- Power BI forums
- Updates
- News & Announcements
- Get Help with Power BI
- Desktop
- Service
- Report Server
- Power Query
- Mobile Apps
- Developer
- DAX Commands and Tips
- Custom Visuals Development Discussion
- Health and Life Sciences
- Power BI Spanish forums
- Translated Spanish Desktop
- Power Platform Integration - Better Together!
- Power Platform Integrations (Read-only)
- Power Platform and Dynamics 365 Integrations (Read-only)
- Training and Consulting
- Instructor Led Training
- Dashboard in a Day for Women, by Women
- Galleries
- Community Connections & How-To Videos
- COVID-19 Data Stories Gallery
- Themes Gallery
- Data Stories Gallery
- R Script Showcase
- Webinars and Video Gallery
- Quick Measures Gallery
- 2021 MSBizAppsSummit Gallery
- 2020 MSBizAppsSummit Gallery
- 2019 MSBizAppsSummit Gallery
- Events
- Ideas
- Custom Visuals Ideas
- Issues
- Issues
- Events
- Upcoming Events
- Community Blog
- Power BI Community Blog
- Custom Visuals Community Blog
- Community Support
- Community Accounts & Registration
- Using the Community
- Community Feedback
Register now to learn Fabric in free live sessions led by the best Microsoft experts. From Apr 16 to May 9, in English and Spanish.
- Power BI forums
- Forums
- Get Help with Power BI
- Desktop
- Re: Line Chart X axis I have 2 Fields, I want to s...
- Subscribe to RSS Feed
- Mark Topic as New
- Mark Topic as Read
- Float this Topic for Current User
- Bookmark
- Subscribe
- Printer Friendly Page
- Mark as New
- Bookmark
- Subscribe
- Mute
- Subscribe to RSS Feed
- Permalink
- Report Inappropriate Content
Line Chart X axis I have 2 Fields, I want to show the X Axis Label from only 1 field.
Hello Community,
I have 2 fields,
Date Field and Text Field called "Test Name". Which i am using it in my X Axis and in the "Y" Axis i am using values.
My Problem:
I want to show only the Date field in the Label for "X Axis" Right now , I am getting both Date and the Test name combined together,
I followed some of the link from this community article to show the labels in 2 lines. Which worked for me.
But What i am looking for is
I just want to show only 1 field which is "Date" field.
Can someone please help me on this.
Thanks
- Mark as New
- Bookmark
- Subscribe
- Mute
- Subscribe to RSS Feed
- Permalink
- Report Inappropriate Content
@sherifff not really sure what you want, why not remove "Test name" column form the x-axis and just keep date column?
✨ Follow us on LinkedIn and  to our YouTube channel
Learn about conditional formatting at Microsoft Reactor
My latest blog post The Power of Using Calculation Groups with Inactive Relationships (Part 1) (perytus.com) I would ❤ Kudos if my solution helped. 👉 If you can spend time posting the question, you can also make efforts to give Kudos to whoever helped to solve your problem. It is a token of appreciation!
⚡ Visit us at https://perytus.com, your one-stop-shop for Power BI-related projects/training/consultancy.
Subscribe to the @PowerBIHowTo YT channel for an upcoming video on List and Record functions in Power Query!!
Learn Power BI and Fabric - subscribe to our YT channel - Click here: @PowerBIHowTo
If my solution proved useful, I'd be delighted to receive Kudos. When you put effort into asking a question, it's equally thoughtful to acknowledge and give Kudos to the individual who helped you solve the problem. It's a small gesture that shows appreciation and encouragement! ❤
Did I answer your question? Mark my post as a solution. Proud to be a Super User! Appreciate your Kudos 🙂
Feel free to email me with any of your BI needs.
- Mark as New
- Bookmark
- Subscribe
- Mute
- Subscribe to RSS Feed
- Permalink
- Report Inappropriate Content
Hi @parry2k ,
In my previous post i have given the field name as "Test Name" it was for each test. The correct X Axis field name is "Batch".
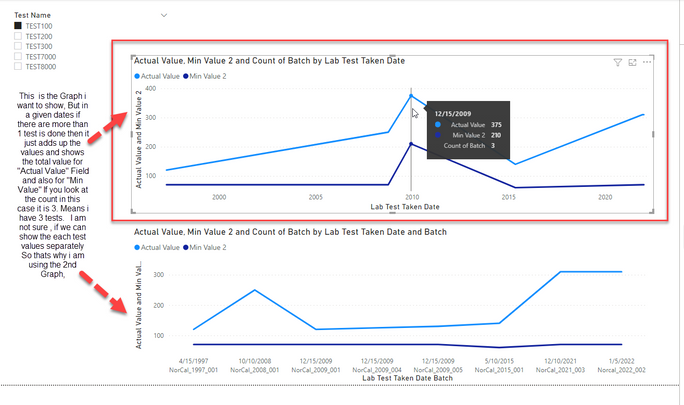
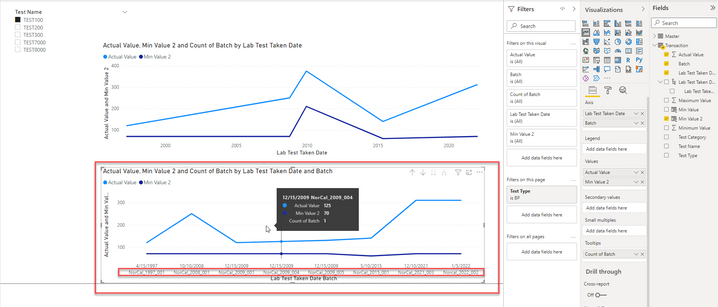
This is the Graph i want to show (Please refer the 1st Screen Shot), But in a given dates if there are more than 1 test is done then it just adds up the values and shows the total value for "Actual Value" Field and also for "Min Value" If you look at the count in this case it is 3. Means i have 3 tests. This is not what we want. We want to show each of the test values seperately (Actual, Min, etc.,) I am not sure/ I don't know , if we can show the each test values separately. So thats why i am using the 2nd Graph, where i am using 2 fields in the X Axis , 1 is "Lab Test Taken Date" and the 2nd is "Batch" Field. The Batch Field has unique name for each of the tests for a given test name and Type based on year. Example : for 1/1/2021 , The Batch Field value is "NorCal_2021_001". In this way i am able to show the unique values , refer the below 2nd screen shot.
Screen Shot #1
2nd Screen Shot: In the below screen, The marked 2nd Field on the X-Axis should be hidden, It should not be visible. As per requirement , it should just show the "Lab Test Taken Date"" Field value.
I hope my requirement is clear.
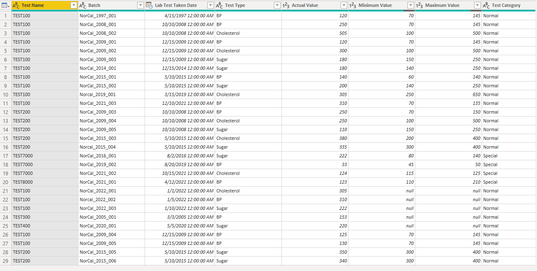
Here is my data details:
THanks for your help in advance!
- Mark as New
- Bookmark
- Subscribe
- Mute
- Subscribe to RSS Feed
- Permalink
- Report Inappropriate Content
Hi @sherifff ,
Here is Line Chart with Custom Label Based on Axis which will help you to get the axis as the data labels.

Download link for the custom visual file in this page,
https://pbivizedit.com/gallery/line-chart-with-custom-label-based-on-axis
This was made with our Custom Visual creator tool PBIVizEdit.com. With this tool,
- anyone, irrespective of technical skills, can create their own visuals
- 15 minutes to create a visual from scratch
- opens up many additional attributes to edit (for e.g. labels, tooltips, legends position, etc)
Give this a shot and let us know if you face any problem/errors.
You can use the editor to modify your visual further (some modifications cannot be done in Power BI window and have to be in editor).
Thanks,
Team PBIVizEdit
- Mark as New
- Bookmark
- Subscribe
- Mute
- Subscribe to RSS Feed
- Permalink
- Report Inappropriate Content
Hi @v-shex-msft @parry2k or Any experts in this forum ,
Could you please provide your valuable input and let me know if this is something possible to achieve or not, so that i can stop investigating on this item.
Thanks for your time.
- Mark as New
- Bookmark
- Subscribe
- Mute
- Subscribe to RSS Feed
- Permalink
- Report Inappropriate Content
Hi @sherifff,
So you mean you want to show the full date field value on your chart without using the batch field?
If that's the case, you can use the date field on the chart axis and right-click on it to use general data mode instead of date hierarchy, then it will show the graph you wanted.
Regards,
Xiaoxin Sheng
If this post helps, please consider accept as solution to help other members find it more quickly.
- Mark as New
- Bookmark
- Subscribe
- Mute
- Subscribe to RSS Feed
- Permalink
- Report Inappropriate Content
Hi @v-shex-msft ,
These are 2 fields, 1 is Batch Field and another is 2 one is "Date" field , the Batch Field is a Text Field. I guess you haven't get my issue correctly, It is not the date hirearchy issue , I am using General Date ( i have already performed the step).
My issue is as of now i have to use both these fields in the X axis but i need to just show only the "Date" Field , Users don't want to see the Batch Details.
any other suggestions please let me know
Thanks.
Helpful resources

Microsoft Fabric Learn Together
Covering the world! 9:00-10:30 AM Sydney, 4:00-5:30 PM CET (Paris/Berlin), 7:00-8:30 PM Mexico City

Power BI Monthly Update - April 2024
Check out the April 2024 Power BI update to learn about new features.

| User | Count |
|---|---|
| 118 | |
| 107 | |
| 69 | |
| 68 | |
| 43 |
| User | Count |
|---|---|
| 148 | |
| 104 | |
| 104 | |
| 89 | |
| 66 |


