- Power BI forums
- Updates
- News & Announcements
- Get Help with Power BI
- Desktop
- Service
- Report Server
- Power Query
- Mobile Apps
- Developer
- DAX Commands and Tips
- Custom Visuals Development Discussion
- Health and Life Sciences
- Power BI Spanish forums
- Translated Spanish Desktop
- Power Platform Integration - Better Together!
- Power Platform Integrations (Read-only)
- Power Platform and Dynamics 365 Integrations (Read-only)
- Training and Consulting
- Instructor Led Training
- Dashboard in a Day for Women, by Women
- Galleries
- Community Connections & How-To Videos
- COVID-19 Data Stories Gallery
- Themes Gallery
- Data Stories Gallery
- R Script Showcase
- Webinars and Video Gallery
- Quick Measures Gallery
- 2021 MSBizAppsSummit Gallery
- 2020 MSBizAppsSummit Gallery
- 2019 MSBizAppsSummit Gallery
- Events
- Ideas
- Custom Visuals Ideas
- Issues
- Issues
- Events
- Upcoming Events
- Community Blog
- Power BI Community Blog
- Custom Visuals Community Blog
- Community Support
- Community Accounts & Registration
- Using the Community
- Community Feedback
Register now to learn Fabric in free live sessions led by the best Microsoft experts. From Apr 16 to May 9, in English and Spanish.
- Power BI forums
- Forums
- Get Help with Power BI
- Desktop
- Last three from a specific year
- Subscribe to RSS Feed
- Mark Topic as New
- Mark Topic as Read
- Float this Topic for Current User
- Bookmark
- Subscribe
- Printer Friendly Page
- Mark as New
- Bookmark
- Subscribe
- Mute
- Subscribe to RSS Feed
- Permalink
- Report Inappropriate Content
Last three from a specific year
Hi all,
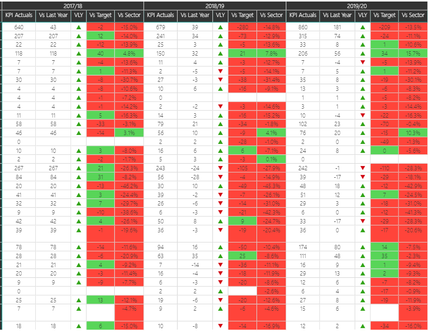
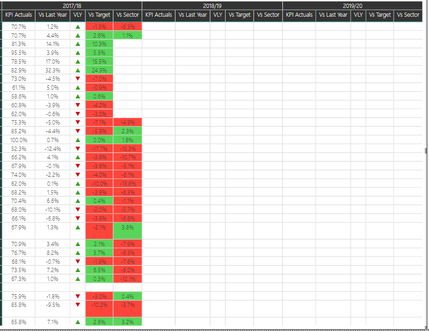
I have a column that identifies whether a year is our most recent year for a specific KPI. Some of our KPIs have been released this year, but some others havent been updated since 2017. So, when I'm tabling this all up, I can sometimes see a nicely populated three year table, like below, and sometimes a sparsely populated table, also below:

I know that for the sparsely populated table there are three years of data going back, but because of how of the shifting years, I can't show it without just showing all years from 2012 to 2019. Please ignore the academic year system. My data reads 2019/20 as 2019, 2018/19 as 2018 and so on, so it all works fine.
Is there a way to build a year measure that show all the dates from a date with a most recent year flag of "Yes" to 3 years back? So for the first table, that would be fine. It would show 2017/18, 2018/19, 2019/20. On the second one, though, it would now only show 2015/16, 2016/17, 2017/18. Voila! Fully populated tables!
I'm thinking the code could look something like:
Datesinperiod(Yeardate,"MostRecentYear"="Y", -3,Year)
I know that doesn't work, but that's the kind of logic Im looking for?
Is this even possible?
- Mark as New
- Bookmark
- Subscribe
- Mute
- Subscribe to RSS Feed
- Permalink
- Report Inappropriate Content
Hi @EpicTriffid ,
Maybe you can take a look at the following blog about using date function to manually defined filter condition and filter range to achieve rolling calculation.
Time Intelligence "The Hard Way" (TITHW)
In addition, are there any specific filters that existed in your calculation formula? (e.g all, allexpect...) They can also affect the calculation results.
Regards,
Xiaoxin Sheng
If this post helps, please consider accept as solution to help other members find it more quickly.
- Mark as New
- Bookmark
- Subscribe
- Mute
- Subscribe to RSS Feed
- Permalink
- Report Inappropriate Content
Hi @v-shex-msft
Thanks for the reply. I'm not entirely sure how to apply the blog post to my report. It seems to be more adding up totals rathet than filtering years shown.
Thee the only functions in the data are switches to change the format.
- Mark as New
- Bookmark
- Subscribe
- Mute
- Subscribe to RSS Feed
- Permalink
- Report Inappropriate Content
HI @EpicTriffid ,
AFAIK, power bi visual will auto-hide blank/empty records, but it not work on your side. Can you please share some dummy data with same data structure for test?
How to Get Your Question Answered Quickly
Regards,
Xiaoxin Sheng
If this post helps, please consider accept as solution to help other members find it more quickly.
Helpful resources

Microsoft Fabric Learn Together
Covering the world! 9:00-10:30 AM Sydney, 4:00-5:30 PM CET (Paris/Berlin), 7:00-8:30 PM Mexico City

Power BI Monthly Update - April 2024
Check out the April 2024 Power BI update to learn about new features.

| User | Count |
|---|---|
| 111 | |
| 100 | |
| 80 | |
| 64 | |
| 58 |
| User | Count |
|---|---|
| 146 | |
| 110 | |
| 93 | |
| 84 | |
| 67 |

