- Power BI forums
- Updates
- News & Announcements
- Get Help with Power BI
- Desktop
- Service
- Report Server
- Power Query
- Mobile Apps
- Developer
- DAX Commands and Tips
- Custom Visuals Development Discussion
- Health and Life Sciences
- Power BI Spanish forums
- Translated Spanish Desktop
- Power Platform Integration - Better Together!
- Power Platform Integrations (Read-only)
- Power Platform and Dynamics 365 Integrations (Read-only)
- Training and Consulting
- Instructor Led Training
- Dashboard in a Day for Women, by Women
- Galleries
- Community Connections & How-To Videos
- COVID-19 Data Stories Gallery
- Themes Gallery
- Data Stories Gallery
- R Script Showcase
- Webinars and Video Gallery
- Quick Measures Gallery
- 2021 MSBizAppsSummit Gallery
- 2020 MSBizAppsSummit Gallery
- 2019 MSBizAppsSummit Gallery
- Events
- Ideas
- Custom Visuals Ideas
- Issues
- Issues
- Events
- Upcoming Events
- Community Blog
- Power BI Community Blog
- Custom Visuals Community Blog
- Community Support
- Community Accounts & Registration
- Using the Community
- Community Feedback
Register now to learn Fabric in free live sessions led by the best Microsoft experts. From Apr 16 to May 9, in English and Spanish.
- Power BI forums
- Forums
- Get Help with Power BI
- Desktop
- Issue with calculating period over period variance
- Subscribe to RSS Feed
- Mark Topic as New
- Mark Topic as Read
- Float this Topic for Current User
- Bookmark
- Subscribe
- Printer Friendly Page
- Mark as New
- Bookmark
- Subscribe
- Mute
- Subscribe to RSS Feed
- Permalink
- Report Inappropriate Content
Issue with calculating period over period variance
Hello!
First off let me start by saying I am brand new to Power BI. 😬
I am trying to calculate a period-over-period variance and display that in my matrix as seen in the screenshot below.
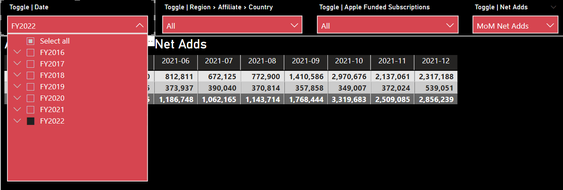
It works just fine when all dates are selected. However, in the example below, when I filter the date to be just fiscal year 2022 (top left in the screenshot) the first date shows a variance against zero because the prior period is not selected in the drop down. Ideally I would like this measure to work without me having to select the prior period.
You can see the formula expression that I have written - where am I going wrong here?
- Mark as New
- Bookmark
- Subscribe
- Mute
- Subscribe to RSS Feed
- Permalink
- Report Inappropriate Content
Hi @mpannella1
Please correct me if I wrongly understood your issue . When you choose year 2022, the value of the first month is not the difference from the last month of last year, but the difference from 0, is it ?
From the formula you provided, it is indeed the difference between the calculation and the previous month. Can you provide your sample(delete sensitive data) ? It will help us handle the problem better.
Best Regard
Community Support Team _ Ailsa Tao
If this post helps, then please consider Accept it as the solution to help the other members find it more quickly.
- Mark as New
- Bookmark
- Subscribe
- Mute
- Subscribe to RSS Feed
- Permalink
- Report Inappropriate Content
Hello! Sorry for the late reply as other areas of work had me distracted for a bit.
My data is housed in an excel file and is setup as seen in the first screenshot below. The yellow fields are calendar/fiscal year specific fields that I have added myself (our fiscal year runs from April > March). Outside of this the data is organized first by month-end, then by country, then by whichever membership tier the user resides in and finally the count of users within that membership tier.
Note: Membership types were deleted due to sensitivity
A requirement of senior management is to be able to view all data using the fiscal calendar, hence me adding in the fiscal calendar fields.
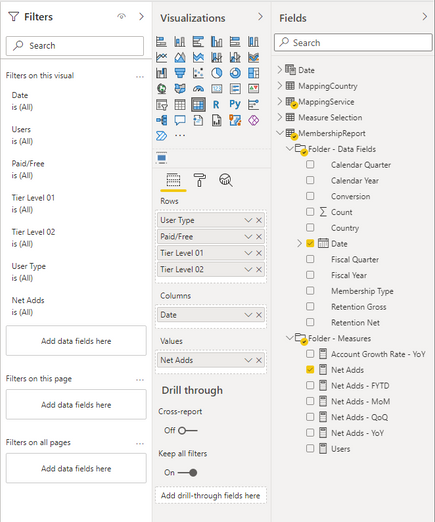
Below you will find another screenshot of my matrix with a depiction of the setup for that matrix in the second screenshot. The third screenshot is the measure formula that can be cycled through using the filter drop down in the top right (Toggle | Net Adds).
Now the issue is when I select ONLY FY22 in the filter drop down on the top left (Toggle | Date) the first period results in an incorrect MoM Net Add figure because for some reason it is subtracting versus zero. However when I select the prior Fiscal Year as well the issue goes away, except for the first month in that Fiscal Year. The issue is the same whether I select MoM/QoQ/YoY. The screenshots below show the filter selection and the way the filter is constructed.
Since my original post I did notice however that if I remove Fiscal Year/Fiscal Quarter from my filter and leave only date (as shown in the screenshots below) the issue goes away.
I cannot figure out why it only works when I remove Fiscal Year/Quarter from my date filter. Being that it is a senior management requirment to have this functionality I need to figure this small piece out. I'm still pretty new to the software though so I am sure it is a very obvious error I am making. Please let me know if you need more details to help address the issue I am facing.
Cheers everyone! 🙂
- Mark as New
- Bookmark
- Subscribe
- Mute
- Subscribe to RSS Feed
- Permalink
- Report Inappropriate Content
@mpannella1 , Refer to my blog and video on that
TI with date table should help
MTD Sales = CALCULATE(SUM(Sales[Sales Amount]),DATESMTD('Date'[Date]))
last MTD Sales = CALCULATE(SUM(Sales[Sales Amount]),DATESMTD(dateadd('Date'[Date],-1,MONTH)))
last month Sales = CALCULATE(SUM(Sales[Sales Amount]),previousmonth('Date'[Date]))
next month Sales = CALCULATE(SUM(Sales[Sales Amount]),nextmonth('Date'[Date]))
this month = CALCULATE(SUM(Sales[Sales Amount]),DATESMTD(ENDOFMONTH('Date'[Date])))
last MTD (complete) Sales = CALCULATE(SUM(Sales[Sales Amount]),DATESMTD(ENDOFMONTH(dateadd('Date'[Date],-1,MONTH))))
Power BI — Month on Month with or Without Time Intelligence
https://medium.com/@amitchandak.1978/power-bi-mtd-questions-time-intelligence-3-5-64b0b4a4090e
https://www.youtube.com/watch?v=6LUBbvcxtKA
Microsoft Power BI Learning Resources, 2023 !!
Learn Power BI - Full Course with Dec-2022, with Window, Index, Offset, 100+ Topics !!
Did I answer your question? Mark my post as a solution! Appreciate your Kudos !! Proud to be a Super User! !!
Helpful resources

Microsoft Fabric Learn Together
Covering the world! 9:00-10:30 AM Sydney, 4:00-5:30 PM CET (Paris/Berlin), 7:00-8:30 PM Mexico City

Power BI Monthly Update - April 2024
Check out the April 2024 Power BI update to learn about new features.

| User | Count |
|---|---|
| 107 | |
| 98 | |
| 78 | |
| 65 | |
| 53 |
| User | Count |
|---|---|
| 144 | |
| 103 | |
| 98 | |
| 85 | |
| 64 |


