Hello,
I have a table with two main columns and a measure:
Rows: Vendor name
Columns: Transaction Date
Values: Accounting Balance
I need to create a matrix in Power BI with this data and the accounting balance added to the previous value.
As a case scenario I will use this example where the totals are calculated vertically (as usual):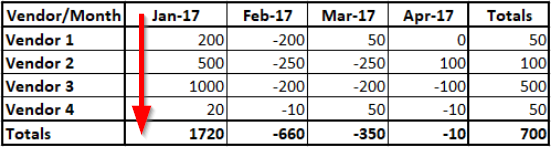
This is what I really need:
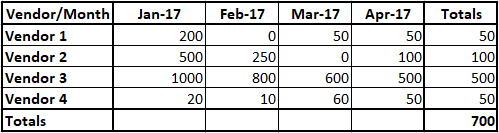
A brief explanation of the previous table:
- Vendor 1 owed $200 on January 2017
- Vendor 1 owed $0 on February 2017 because he made a $200 payment
- Vendor 1 owed $50 on March 2017 because $0 + $50
- Vendor 1 owed $50 on April 2017 because he didn't make any payment.
- Vendor 1 owes $50 in total.
- etc
In other words I need to calculate the payments made by vendor for each month / column totals (that he owes in total). The last month (the current) will have the same debt as the total because it is cumulative.
Any suggestions? Thanks in advance


