- Power BI forums
- Updates
- News & Announcements
- Get Help with Power BI
- Desktop
- Service
- Report Server
- Power Query
- Mobile Apps
- Developer
- DAX Commands and Tips
- Custom Visuals Development Discussion
- Health and Life Sciences
- Power BI Spanish forums
- Translated Spanish Desktop
- Power Platform Integration - Better Together!
- Power Platform Integrations (Read-only)
- Power Platform and Dynamics 365 Integrations (Read-only)
- Training and Consulting
- Instructor Led Training
- Dashboard in a Day for Women, by Women
- Galleries
- Community Connections & How-To Videos
- COVID-19 Data Stories Gallery
- Themes Gallery
- Data Stories Gallery
- R Script Showcase
- Webinars and Video Gallery
- Quick Measures Gallery
- 2021 MSBizAppsSummit Gallery
- 2020 MSBizAppsSummit Gallery
- 2019 MSBizAppsSummit Gallery
- Events
- Ideas
- Custom Visuals Ideas
- Issues
- Issues
- Events
- Upcoming Events
- Community Blog
- Power BI Community Blog
- Custom Visuals Community Blog
- Community Support
- Community Accounts & Registration
- Using the Community
- Community Feedback
Register now to learn Fabric in free live sessions led by the best Microsoft experts. From Apr 16 to May 9, in English and Spanish.
- Power BI forums
- Forums
- Get Help with Power BI
- Desktop
- Re: Is there a way to check with date dimension is...
- Subscribe to RSS Feed
- Mark Topic as New
- Mark Topic as Read
- Float this Topic for Current User
- Bookmark
- Subscribe
- Printer Friendly Page
- Mark as New
- Bookmark
- Subscribe
- Mute
- Subscribe to RSS Feed
- Permalink
- Report Inappropriate Content
Is there a way to check with date dimension is filtered on a chart : by day, by month, by year?
Dear BI users,
Is there a way to check with date dimension is filtered on a chart : by day, by month, by year?
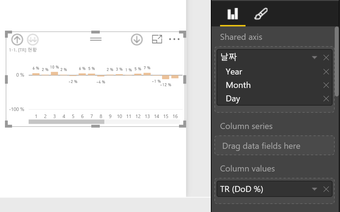
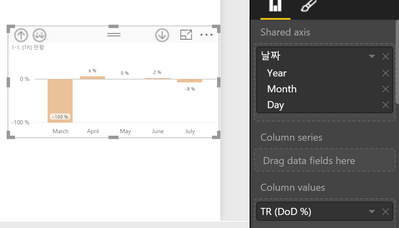
This is for switching DoD & MoM on a chart by X-axis date dimension.
My purpose and the findings of details so far listed below.
Purpose
- Show the MoM and DoD data
- Hope to show both MoM and DoD on one chart to better experience
- X-axis could be changed by Drill Up/Down or Slicer
- (Check below captured charts)
Findings
- Made measures for DoD and MoM helped by (http://community.powerbi.com/t5/Community-Blog/Monitor-your-Website-Growth-with-one-click-with-Googl...)
- Available to check the filter activaction on one column by "ISFILTERED" DAX function
- However, the [dates] column is mix of day/month/year and "ISFILTERED" can not be adapted


Sincerely,
Lee, Hong Gwoo
Solved! Go to Solution.
- Mark as New
- Bookmark
- Subscribe
- Mute
- Subscribe to RSS Feed
- Permalink
- Report Inappropriate Content
OK, and I'm just confirming and talking this out in my head, what we need to do is either:
- Find a way to switch up which measure we are using in the chart based upon the filter context for that chart
- Find a way to use a single formula for calculating both DoD and MoM
- Find a way to combine DoD and MoM into a single aggregate measure that gets filtered based upon the filter context of the chart
Honestly, I'm not sure any of those are possible but I'll spend some cycles noodling on it. The one that strikes me as the most plausible is #2 using something like PARALLELPERIOD maybe? Not thinking of an easy solution.
@ me in replies or I'll lose your thread!!!
Instead of a Kudo, please vote for this idea
Become an expert!: Enterprise DNA
External Tools: MSHGQM
YouTube Channel!: Microsoft Hates Greg
Latest book!: The Definitive Guide to Power Query (M)
DAX is easy, CALCULATE makes DAX hard...
- Mark as New
- Bookmark
- Subscribe
- Mute
- Subscribe to RSS Feed
- Permalink
- Report Inappropriate Content
I am not understanding your issue. It looks like you have a single chart that has a Month and Day hierarchy that you can drill down and up or are you saying that you want to display both the MoM or DoD at the same time in a single visualization. I do not understand where the ISFILTERED comes into play. Can you please clarify?
@ me in replies or I'll lose your thread!!!
Instead of a Kudo, please vote for this idea
Become an expert!: Enterprise DNA
External Tools: MSHGQM
YouTube Channel!: Microsoft Hates Greg
Latest book!: The Definitive Guide to Power Query (M)
DAX is easy, CALCULATE makes DAX hard...
- Mark as New
- Bookmark
- Subscribe
- Mute
- Subscribe to RSS Feed
- Permalink
- Report Inappropriate Content
First of all, thanks for your interest on the issue.
I illustrate the issue clearly below. Hope it helps your better understanding.
Purpose
- [In case of day view on X-axis] Chart shows DoD growth rate
- [In case of month view on X-axis] Chart shows MoM growth rate
- Above two are occured in same chart
- and X-axis is with date/time type column which is automatically hierarhied by Power BI as usual
Expected Solution
- Any DAX measure (like ISFILTERED) can switch DoD and MoM Measures by drill down/up to month and day
- Any formula with DAX measure which can calculate DoD and MoM simultaneously
Sincerely,
Lee, Hong Gwoo
- Mark as New
- Bookmark
- Subscribe
- Mute
- Subscribe to RSS Feed
- Permalink
- Report Inappropriate Content
OK, I'm pretty sure I get it now, can you post your formulas for DoD and MoM?
@ me in replies or I'll lose your thread!!!
Instead of a Kudo, please vote for this idea
Become an expert!: Enterprise DNA
External Tools: MSHGQM
YouTube Channel!: Microsoft Hates Greg
Latest book!: The Definitive Guide to Power Query (M)
DAX is easy, CALCULATE makes DAX hard...
- Mark as New
- Bookmark
- Subscribe
- Mute
- Subscribe to RSS Feed
- Permalink
- Report Inappropriate Content
Below is the formulars.
Thanks in advance for your kindness.
- Revenue (DoD %) = DIVIDE([Revenue (Today)]-[Revenue (Today -1)], [Revenue (Today -1)])
Revenue (Today) = CALCULATE([Revenue (SUM)], DATEADD ( LASTDATE ( 'Dates'[Dates] ), 0, DAY )) +0
Revenue (Today -1) = CALCULATE([Revenue (SUM)], DATEADD ( LASTDATE ( 'Dates'[Dates] ), -1, DAY ))
- Revenue (MoM %) = DIVIDE ([Revenue (Month)] - [Revenue (Month-1)], [Revenue (Month-1)])
Revenue (Month) = TOTALMTD([Revenue (SUM)],'Dates'[Dates])
Revenue (Month-1) = TOTALMTD([Revenue (SUM)],PREVIOUSMONTH('Dates'[Dates]))
- Revenue (SUM) = SUMX('Revenue',[Revenue])
BR,
Lee
- Mark as New
- Bookmark
- Subscribe
- Mute
- Subscribe to RSS Feed
- Permalink
- Report Inappropriate Content
@extri13 - Something I just found that you might want to vote for (although it is already started):
@ me in replies or I'll lose your thread!!!
Instead of a Kudo, please vote for this idea
Become an expert!: Enterprise DNA
External Tools: MSHGQM
YouTube Channel!: Microsoft Hates Greg
Latest book!: The Definitive Guide to Power Query (M)
DAX is easy, CALCULATE makes DAX hard...
- Mark as New
- Bookmark
- Subscribe
- Mute
- Subscribe to RSS Feed
- Permalink
- Report Inappropriate Content
OK, and I'm just confirming and talking this out in my head, what we need to do is either:
- Find a way to switch up which measure we are using in the chart based upon the filter context for that chart
- Find a way to use a single formula for calculating both DoD and MoM
- Find a way to combine DoD and MoM into a single aggregate measure that gets filtered based upon the filter context of the chart
Honestly, I'm not sure any of those are possible but I'll spend some cycles noodling on it. The one that strikes me as the most plausible is #2 using something like PARALLELPERIOD maybe? Not thinking of an easy solution.
@ me in replies or I'll lose your thread!!!
Instead of a Kudo, please vote for this idea
Become an expert!: Enterprise DNA
External Tools: MSHGQM
YouTube Channel!: Microsoft Hates Greg
Latest book!: The Definitive Guide to Power Query (M)
DAX is easy, CALCULATE makes DAX hard...
- Mark as New
- Bookmark
- Subscribe
- Mute
- Subscribe to RSS Feed
- Permalink
- Report Inappropriate Content
Thank you very much.
It seems like there is no right answer for my need based on the opinion of you who is one of the most professional user on this board I've seen so far.
I am really really impressed by your kindness and passion for BI from your answer.
Also, it is still a good answer that there is no solution.
Thanks again
Lee, Hong Gwoo
Helpful resources

Microsoft Fabric Learn Together
Covering the world! 9:00-10:30 AM Sydney, 4:00-5:30 PM CET (Paris/Berlin), 7:00-8:30 PM Mexico City

Power BI Monthly Update - April 2024
Check out the April 2024 Power BI update to learn about new features.

| User | Count |
|---|---|
| 109 | |
| 98 | |
| 77 | |
| 66 | |
| 54 |
| User | Count |
|---|---|
| 144 | |
| 104 | |
| 101 | |
| 86 | |
| 64 |
