- Power BI forums
- Updates
- News & Announcements
- Get Help with Power BI
- Desktop
- Service
- Report Server
- Power Query
- Mobile Apps
- Developer
- DAX Commands and Tips
- Custom Visuals Development Discussion
- Health and Life Sciences
- Power BI Spanish forums
- Translated Spanish Desktop
- Power Platform Integration - Better Together!
- Power Platform Integrations (Read-only)
- Power Platform and Dynamics 365 Integrations (Read-only)
- Training and Consulting
- Instructor Led Training
- Dashboard in a Day for Women, by Women
- Galleries
- Community Connections & How-To Videos
- COVID-19 Data Stories Gallery
- Themes Gallery
- Data Stories Gallery
- R Script Showcase
- Webinars and Video Gallery
- Quick Measures Gallery
- 2021 MSBizAppsSummit Gallery
- 2020 MSBizAppsSummit Gallery
- 2019 MSBizAppsSummit Gallery
- Events
- Ideas
- Custom Visuals Ideas
- Issues
- Issues
- Events
- Upcoming Events
- Community Blog
- Power BI Community Blog
- Custom Visuals Community Blog
- Community Support
- Community Accounts & Registration
- Using the Community
- Community Feedback
Register now to learn Fabric in free live sessions led by the best Microsoft experts. From Apr 16 to May 9, in English and Spanish.
- Power BI forums
- Forums
- Get Help with Power BI
- Desktop
- Is it possible to create a bar chart that shows bo...
- Subscribe to RSS Feed
- Mark Topic as New
- Mark Topic as Read
- Float this Topic for Current User
- Bookmark
- Subscribe
- Printer Friendly Page
- Mark as New
- Bookmark
- Subscribe
- Mute
- Subscribe to RSS Feed
- Permalink
- Report Inappropriate Content
Is it possible to create a bar chart that shows both calculated columns and a measure?
I have a simple date table with a calculated column used as a flag to indicate whether the date is "Current Month", "Previous Month" (blank = everything else).
I also have a simple bar chart which takes a summary of resources per the above two flags (i.e. one bar for "Current Month" and one bar for "Previous Month").
What I want is to introduce a new flag for "Previous Three Months" which includes Current Month + Previous Month + PreviousPrevious Month (e.g. for December 2021, this flag should include all dates in December 2021, November 2021 and October 2021).
I'm struggling to think how I can achieve this or if I am missing something obvious! Any help would be much appreciated 🙂
Solved! Go to Solution.
- Mark as New
- Bookmark
- Subscribe
- Mute
- Subscribe to RSS Feed
- Permalink
- Report Inappropriate Content
Hi @Anonymous
Thanks so much for that. You are very close already to what you want to achieve.
There are a few ways to achieve what you want.
1. Create a measure such as the following (it should be quite simple if the three periods (Current Month, Previous Month, and Previous Previous Month are the only "periods" in the Period column).
SumNonBlanks = CALCULATE ( SUM ( 'Table'[Amount] ) , FILTER ( 'Date'[Period] <> BLANK() ) )
2. I believe you should be able to create to quick measures using SUM and then TOTALQTD:
SumMeasure = SUM ( 'Table'[Utilisation] )
TotalQTD = TOTALQTD ( [SumMeasure] , 'Date'[Date] )
Let me know if the above work. You should be able to add them as a separate value to your existing visual.
Hoping this works 🙂
If I have posted a response that resolves your question, please accept it as a solution to formally close the post.
Also, if you are as passionate about Power BI, DAX and data as I am, please feel free to reach out if you have any questions, queries, or if you simply want to connect and talk to another data geek!
Want to connect?www.linkedin.com/in/theoconias
- Mark as New
- Bookmark
- Subscribe
- Mute
- Subscribe to RSS Feed
- Permalink
- Report Inappropriate Content
Hi Theo sorry I didn't get a chance to respond yesterday as other things came up at work!
Thank you for all of your help (and patience!).
I finally figured out the issue. I was using a Legend on my bar chart to split out the three periods (Current Month, Previous Month and PP.Month) and so any value I added to the chart would be shown by those periods. That's why I was unable to separately show the "3 month utilisation" value as this was also being broken down by the three periods.
I ended up creating three separate measures for 1) current month, 2) previous month, and 3) 3 Month Running Total and adding these as values to the bar chart and removing the Legend.
Thank you!
- Mark as New
- Bookmark
- Subscribe
- Mute
- Subscribe to RSS Feed
- Permalink
- Report Inappropriate Content
Hi @Anonymous are you able to share a screenshot of the visual and what you ideally want to include in it?
In terms of flagging whether the month is the Previous Previous Month (i.e. October 2021 per your example), that shouldn't be too hard at all. Ideally, it would be best to replicate the approach you have taken to flag the Previous Month (i.e. November 2021). Are you able to way you flagged the Previous Month and we can look to replicate it to get you the Previous Previous Month or, alternatively, provide some input on the best way to flag Current Month, Previous Month and Previous Previous Month.
Look forward to hearing from you either way.
Thanks heaps,
Theo
If I have posted a response that resolves your question, please accept it as a solution to formally close the post.
Also, if you are as passionate about Power BI, DAX and data as I am, please feel free to reach out if you have any questions, queries, or if you simply want to connect and talk to another data geek!
Want to connect?www.linkedin.com/in/theoconias
- Mark as New
- Bookmark
- Subscribe
- Mute
- Subscribe to RSS Feed
- Permalink
- Report Inappropriate Content
Hi Theo,
Thanks for your response and apologies I didn't explain my first post too well.
It's not PreviousPreviousMonth that I want to show, but the previous 3 months combined (this would include Current Month + Previous Month + PPM)
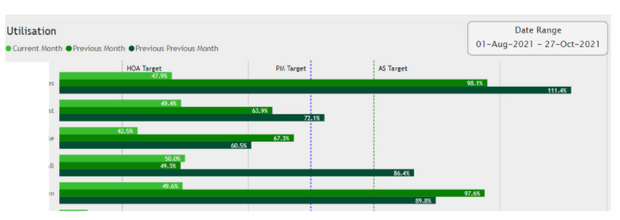
The screenshot below shows the current bar chart with the three periods:
I essentially want to replace the "Previous Previous Month" bar with a running 3-month total instead, so for each user the chart should show i) Current Month's utilisation, ii) Previous Month's Utilisation, iii) Total Utilisation Last 3 Months.
I'm unsure how I can set a flag in my date table for "Last 3 months" as this would also include the Current Month and Previous Month flags.
I can currently show a running total in a separate chart using a measure, but I'm not sure how I can combine that measure in the above chart to show both things in one chart. Is such a thing even possible?
Thanks again.
- Mark as New
- Bookmark
- Subscribe
- Mute
- Subscribe to RSS Feed
- Permalink
- Report Inappropriate Content
Hi @Anonymous
That makes a lot of sense. It is definitely possible. Basically, all you need to do is create a new measure that adds the separate measures together that you have already created.
I am on the phone and won't be in front of computer until tomorrow but if you cannot get it to work as you need, just screenshot some dummy / sample data and I will send through a solution first thing unless someone else comes through with it in the meantime 🙂
Have a lovely evening from Australia!
Theo
If I have posted a response that resolves your question, please accept it as a solution to formally close the post.
Also, if you are as passionate about Power BI, DAX and data as I am, please feel free to reach out if you have any questions, queries, or if you simply want to connect and talk to another data geek!
Want to connect?www.linkedin.com/in/theoconias
- Mark as New
- Bookmark
- Subscribe
- Mute
- Subscribe to RSS Feed
- Permalink
- Report Inappropriate Content
Thanks again Theo.
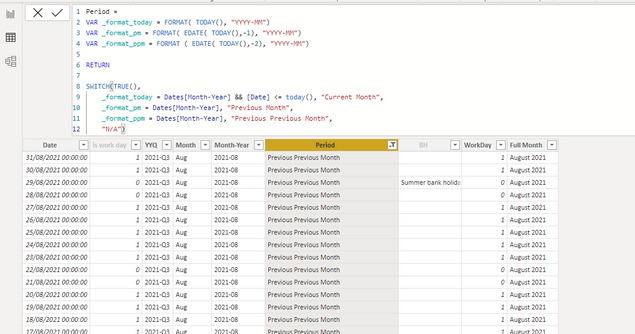
This is my date table with the "Period" flag:
Period =
VAR _format_today = FORMAT( TODAY(), "YYYY-MM")
VAR _format_pm = FORMAT( EDATE( TODAY(),-1), "YYYY-MM")
VAR _format_ppm = FORMAT ( EDATE( TODAY(),-2), "YYYY-MM")

RETURN

SWITCH(TRUE(),
    _format_today = Dates[Month-Year] && [Date] <= today(), "Current Month",
    _format_pm = Dates[Month-Year], "Previous Month",
    _format_ppm = Dates[Month-Year], "Previous Previous Month",
    "N/A")
I am then using this "Period" column as a legend in my bar chart which brings back the three options (I am filtering out "N/A"). This is against a simple timesheet table with a relationship to the Date table:
If I create a measure to calculate the total utilisation for last three months, how can I incorporate this in my existing legend (which is using a calculated column from the Date table)?
Thanks
Helpful resources

Microsoft Fabric Learn Together
Covering the world! 9:00-10:30 AM Sydney, 4:00-5:30 PM CET (Paris/Berlin), 7:00-8:30 PM Mexico City

Power BI Monthly Update - April 2024
Check out the April 2024 Power BI update to learn about new features.

| User | Count |
|---|---|
| 109 | |
| 96 | |
| 77 | |
| 66 | |
| 54 |
| User | Count |
|---|---|
| 144 | |
| 104 | |
| 102 | |
| 88 | |
| 63 |


