- Power BI forums
- Updates
- News & Announcements
- Get Help with Power BI
- Desktop
- Service
- Report Server
- Power Query
- Mobile Apps
- Developer
- DAX Commands and Tips
- Custom Visuals Development Discussion
- Health and Life Sciences
- Power BI Spanish forums
- Translated Spanish Desktop
- Power Platform Integration - Better Together!
- Power Platform Integrations (Read-only)
- Power Platform and Dynamics 365 Integrations (Read-only)
- Training and Consulting
- Instructor Led Training
- Dashboard in a Day for Women, by Women
- Galleries
- Community Connections & How-To Videos
- COVID-19 Data Stories Gallery
- Themes Gallery
- Data Stories Gallery
- R Script Showcase
- Webinars and Video Gallery
- Quick Measures Gallery
- 2021 MSBizAppsSummit Gallery
- 2020 MSBizAppsSummit Gallery
- 2019 MSBizAppsSummit Gallery
- Events
- Ideas
- Custom Visuals Ideas
- Issues
- Issues
- Events
- Upcoming Events
- Community Blog
- Power BI Community Blog
- Custom Visuals Community Blog
- Community Support
- Community Accounts & Registration
- Using the Community
- Community Feedback
Register now to learn Fabric in free live sessions led by the best Microsoft experts. From Apr 16 to May 9, in English and Spanish.
- Power BI forums
- Forums
- Get Help with Power BI
- Desktop
- Interactive Drill Down Visual Dashboard
- Subscribe to RSS Feed
- Mark Topic as New
- Mark Topic as Read
- Float this Topic for Current User
- Bookmark
- Subscribe
- Printer Friendly Page
- Mark as New
- Bookmark
- Subscribe
- Mute
- Subscribe to RSS Feed
- Permalink
- Report Inappropriate Content
Interactive Drill Down Visual Dashboard
Hi all,
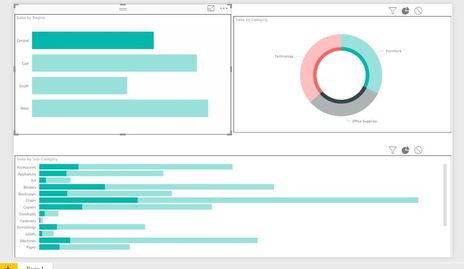
I am trying to build an interactive dashboard, but facing an issue. I have three views in the dashboard as shown below,


- Mark as New
- Bookmark
- Subscribe
- Mute
- Subscribe to RSS Feed
- Permalink
- Report Inappropriate Content
If I am understanding your question correctly I beleive this is possible through Edit Interactions options.
- First click the Edit Interactions button in the Home ribbon.
- Then click on the region visualization like shown in your firs picture.
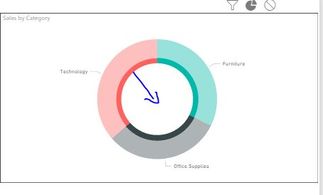
- Then change interaction between region and subcateogry from Highlight to Filtered. This is done by clicking on the filter icon in the top right of the subcategory visualization. I put a red arrow next to where to do this in the picture below.
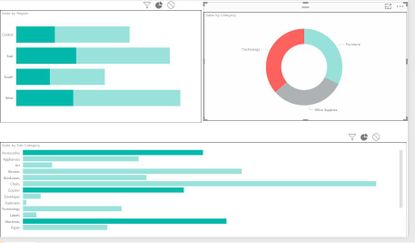
- Now when a region is highlighted it should drill into the subcategory and show the filtered version of the donut chart instead of the highlighted version.
Let me know if this is what you are trying to accomplish!
- Mark as New
- Bookmark
- Subscribe
- Mute
- Subscribe to RSS Feed
- Permalink
- Report Inappropriate Content
When you are in Edit Interactions, you are no longer in the dashboard, right? The problem I'm facing too is that the drill down functionality is not enabled in the dashboard.
- Mark as New
- Bookmark
- Subscribe
- Mute
- Subscribe to RSS Feed
- Permalink
- Report Inappropriate Content
Hi Twan,
Thank you for the reply, I have tried edit interactions, but when I clik on sales category view to filter sales sub-category.Its not filtering based on the filtered region in the sales category, its filtering by all regions in the sales category.
Thank you
Regards, Anil Kumar.
- Mark as New
- Bookmark
- Subscribe
- Mute
- Subscribe to RSS Feed
- Permalink
- Report Inappropriate Content
I think what you are trying to do is not possible right now with Power BI. Normally you could do something like ctrl + clicking different charts to cross filter each of the different charts based on what you clicked. Here is an ideas post you can upvote that would add that functionality.
What could work for now is if you put slicers on the canvas for Region, Category and Subcategory. Then use the slicers for cross filtering instead of clicking on the charts.
- Mark as New
- Bookmark
- Subscribe
- Mute
- Subscribe to RSS Feed
- Permalink
- Report Inappropriate Content
Help me , how to attach Power BI report?
Helpful resources

Microsoft Fabric Learn Together
Covering the world! 9:00-10:30 AM Sydney, 4:00-5:30 PM CET (Paris/Berlin), 7:00-8:30 PM Mexico City

Power BI Monthly Update - April 2024
Check out the April 2024 Power BI update to learn about new features.

| User | Count |
|---|---|
| 111 | |
| 94 | |
| 82 | |
| 66 | |
| 59 |
| User | Count |
|---|---|
| 151 | |
| 121 | |
| 104 | |
| 87 | |
| 67 |


