- Power BI forums
- Updates
- News & Announcements
- Get Help with Power BI
- Desktop
- Service
- Report Server
- Power Query
- Mobile Apps
- Developer
- DAX Commands and Tips
- Custom Visuals Development Discussion
- Health and Life Sciences
- Power BI Spanish forums
- Translated Spanish Desktop
- Power Platform Integration - Better Together!
- Power Platform Integrations (Read-only)
- Power Platform and Dynamics 365 Integrations (Read-only)
- Training and Consulting
- Instructor Led Training
- Dashboard in a Day for Women, by Women
- Galleries
- Community Connections & How-To Videos
- COVID-19 Data Stories Gallery
- Themes Gallery
- Data Stories Gallery
- R Script Showcase
- Webinars and Video Gallery
- Quick Measures Gallery
- 2021 MSBizAppsSummit Gallery
- 2020 MSBizAppsSummit Gallery
- 2019 MSBizAppsSummit Gallery
- Events
- Ideas
- Custom Visuals Ideas
- Issues
- Issues
- Events
- Upcoming Events
- Community Blog
- Power BI Community Blog
- Custom Visuals Community Blog
- Community Support
- Community Accounts & Registration
- Using the Community
- Community Feedback
Register now to learn Fabric in free live sessions led by the best Microsoft experts. From Apr 16 to May 9, in English and Spanish.
- Power BI forums
- Forums
- Get Help with Power BI
- Desktop
- Re: Indicadores para avances de proyectos / Indica...
- Subscribe to RSS Feed
- Mark Topic as New
- Mark Topic as Read
- Float this Topic for Current User
- Bookmark
- Subscribe
- Printer Friendly Page
- Mark as New
- Bookmark
- Subscribe
- Mute
- Subscribe to RSS Feed
- Permalink
- Report Inappropriate Content
Indicadores para avances de proyectos / Indicators for project progress
Hola amigos.
Soy un novato en esto de power bi y dax, pero necesito realizar un gran trabajo para un tablero y por más que le he dado vueltas no he podido llegar a destino.
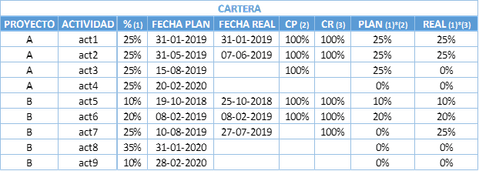
Cuento con una tabla de una base de datos con una estructura similar a la siguiente:
Y necesito realizar lo que tratare de explicar a continuación:
A) Necesito obtener una tabla resumen con el avance por proyectos a la fecha actual, tanto planificado como real, siguiendo el mismo ejemplo sería algo así:
B) Y lo mismo pero solo considerando las actividades planificadas para el 2019:
C) Luego tambien necesito obtener los promedios de avance para todo el periodo (lo cual tengo pensado visualizar en un medidor u odometro):
D) Y lo mismo pero solo para las actividades del 2019, considerando lo del 2019 de 0 a 100% (visualizando mediante un medidor u odometro):
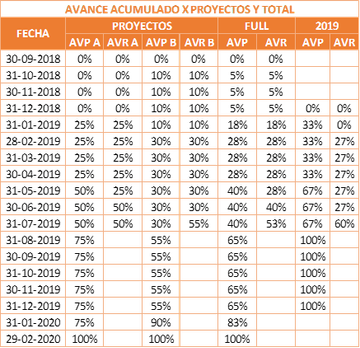
E) Y por otro lado tambien necesito confeccionar la siguiente tabla con los avances acumulados por proyecto y como total promedio:
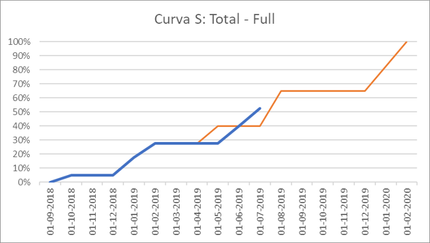
F) Para terminar es necesario que genere las Curvas S de avance, ya sea como vista de todo el periodo (full):
G) Así como tambien considerando solo el 2019 (al 100%):
H) Y tambien una vista acotada para el 2019, pero considerando los valores de todo el periodo (sin llevarlo a 100%):
Favor si pueden ayudarme a orientarme con las formulas que requiero para cada cosa, sería sensacional.
Agradecido!
-----
Hi friends.
I'm a newbie on power bi and dax, and I need to do a great job for a board. I've tried to do it, but my efforts has been unsuccessful.
First I have a data base table with a structure similar to the following:
And I need to do what I'm going to trie to explain next:
A) I need to obtain a summary table with the progress by projects to the current date, both planned and actual, following the same example would be something like this:
B) And the same but only considering the activities planned for 2019:
C) Then I also need to obtain the progress averages for the entire period (which I plan to visualize on a meter or odometer):
D) And the same but only for the activities planned for 2019, considering the 2019 from 0 to 100% (visualizing by means of a meter or odometer):
E) And on the other hand I also need to prepare the following table with the accumulated progress per project and as an total's average:
F) To finish, I needo to generate the S Curses, viewing the entire period (full):
G) As well as considering only 2019 (100%):
H) And also a bounded view for 2019, but considering the values of the entire period (without bringing it to 100%):
Please if you can help me to guide me with the formulas that I require for each thing, it would be awesome.
Grateful regards!
- Mark as New
- Bookmark
- Subscribe
- Mute
- Subscribe to RSS Feed
- Permalink
- Report Inappropriate Content
Hi @MauroBote
From above, i can understand how to get table (A), but it is diffcult to understand the other tables.
For the table(E), it is better to share your expected table based on sample data.
Best Regards
Maggie
Community Support Team _ Maggie Li
If this post helps, then please consider Accept it as the solution to help the other members find it more quickly.
- Mark as New
- Bookmark
- Subscribe
- Mute
- Subscribe to RSS Feed
- Permalink
- Report Inappropriate Content
Hi Maggie.
Thanks for your responde. I'll try to explain every table:
I think it might be useful if I start explaining the headings of the source table:
- Proyecto = Projects
- Actividad = Activities from projects
- % = Percentage weight of activities on project
- Fecha Plan = Planification date when the activity must be done
- Fecha Real = Actual or real date when the activity was effectively done
- CP (Cumplimiento Plan) = Accomplishment plan. It turns 100% when a "Fecha Plan" is earlier than today's date
- CR (Cumplimiento Real) = Accomplishment real. It turns 100% when a "Fecha Real" exist
- Plan = % * CP
- Real = % * CR
A) Headers:
AVP (Avance Plan) = Planification progress for the entire period. Sum of every "Plan" per projects = SUM(Plan)
AVR (Avance Real) = Actual progress for the entire period. Sum of every "Real" per projects = SUM(Real)
B) Headers are the same explained previously but only considering the activities planned for the current year period (by use of relatives filter of the visual table), and considering them as the 100% of the projects
AVP = SUM(Plan / SUM(%))
AVR = SUM(Real / SUM(%))
First AVP = 25%/75% + 25%/75% + 25%/75% = (25% + 25% + 25%)/(75%)
First AVR = 25%/75% + 25%/75% + 0%/75% = (25% + 25% + 0%)/(75%)
C) Average of values obtained in table A)
First Total = AVERAGE(75%;30%)
Second Total = AVERAGE(50%;55%)
D) Same of C) but using the results of table B)
First Total = AVERAGE(100%;44%)
Second Total = AVERAGE(67%;100%)
E) The date column was completed with the end days of each month determined between the earliest - 1 month (between project A and B) and the latest date (between project A and B)
The table has tree diferent calculation:
First (Proyectos): Planification (AVP A, AVP B) and Actual (AVR A, AVR B) accumulated progress per month and per project. The actual progress is calculated until the last month over
Second (Full): Average accumulated progress of first calculation
Third (2019): Average accumulated progress considering just activities of the current year divided by total of % planificated for the current year as well, same thing of B). It is importante for these to obtain the current's year accumulated progreess per project if someone use visual filters
F) S Curve for the second calculation of E)
G) S Curve for the third calculation of E)
H) Same of F) but considering the current year period (without dividing by sum of % per project) on the graph
Looking forward your response.
Thanks a lot in advance!
Helpful resources

Microsoft Fabric Learn Together
Covering the world! 9:00-10:30 AM Sydney, 4:00-5:30 PM CET (Paris/Berlin), 7:00-8:30 PM Mexico City

Power BI Monthly Update - April 2024
Check out the April 2024 Power BI update to learn about new features.

| User | Count |
|---|---|
| 111 | |
| 100 | |
| 80 | |
| 64 | |
| 58 |
| User | Count |
|---|---|
| 148 | |
| 111 | |
| 93 | |
| 84 | |
| 66 |


