- Power BI forums
- Updates
- News & Announcements
- Get Help with Power BI
- Desktop
- Service
- Report Server
- Power Query
- Mobile Apps
- Developer
- DAX Commands and Tips
- Custom Visuals Development Discussion
- Health and Life Sciences
- Power BI Spanish forums
- Translated Spanish Desktop
- Power Platform Integration - Better Together!
- Power Platform Integrations (Read-only)
- Power Platform and Dynamics 365 Integrations (Read-only)
- Training and Consulting
- Instructor Led Training
- Dashboard in a Day for Women, by Women
- Galleries
- Community Connections & How-To Videos
- COVID-19 Data Stories Gallery
- Themes Gallery
- Data Stories Gallery
- R Script Showcase
- Webinars and Video Gallery
- Quick Measures Gallery
- 2021 MSBizAppsSummit Gallery
- 2020 MSBizAppsSummit Gallery
- 2019 MSBizAppsSummit Gallery
- Events
- Ideas
- Custom Visuals Ideas
- Issues
- Issues
- Events
- Upcoming Events
- Community Blog
- Power BI Community Blog
- Custom Visuals Community Blog
- Community Support
- Community Accounts & Registration
- Using the Community
- Community Feedback
Register now to learn Fabric in free live sessions led by the best Microsoft experts. From Apr 16 to May 9, in English and Spanish.
- Power BI forums
- Forums
- Get Help with Power BI
- Desktop
- Re: Index match
- Subscribe to RSS Feed
- Mark Topic as New
- Mark Topic as Read
- Float this Topic for Current User
- Bookmark
- Subscribe
- Printer Friendly Page
- Mark as New
- Bookmark
- Subscribe
- Mute
- Subscribe to RSS Feed
- Permalink
- Report Inappropriate Content
Index match
Good day
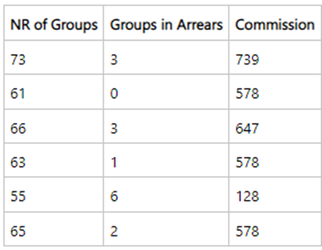
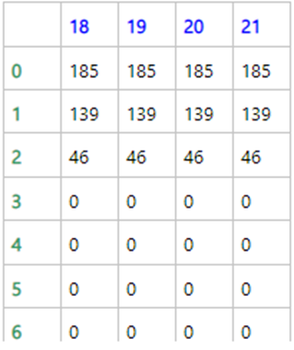
I have a dataset (table1) where the Commission is calculated by matching NR of Groups and Groups in Arrears in table 2 . NR of Groups in table 2 is highlighted in Blue and Groups in Arrears is highlighted in Green, values are Commission.
Since I'm automating the report into Power BI, I need to replicate the dataset and the formula but I'm struggling to organise the dataset to enble me to do proper PBI calculations.
This is the Excel formula used to achieve this: Scheme is table 2 in this post.
=IF(OR(F10>13,E10<18),0,INDEX(Scheme!$C$39:$DU$53,MATCH(F10,Scheme!$B$39:$B$53,0),MATCH(E10,Scheme!$C$38:$DU$38,0)))
To explain the formula in simple terms. If NR of Groups = 18 and Groups in Arrears = 1 then Commission will be R139 etc..
The tables below are just snapshots, they are longer hence the formula has cells up to DU38.
table1
table 2
Any idea on how to go about this?
Thank you
Solved! Go to Solution.
- Mark as New
- Bookmark
- Subscribe
- Mute
- Subscribe to RSS Feed
- Permalink
- Report Inappropriate Content
@Bifinity_75 thank you. Because Arrears and NR of Groups are two standalone tables, I joined them on SQL table then bought in as Groups_Arrears table. I then joined the table to the Commission's one through the key, as suggested (see below).
So now I'm able to create a table visual as below, which is excellent. Thank you for your help.
- Mark as New
- Bookmark
- Subscribe
- Mute
- Subscribe to RSS Feed
- Permalink
- Report Inappropriate Content
Hi @Tlotly , try this:
1.- In Table 2, select the first column like the image, and select Unpivot other columns:
2.- Go to Relationship, and create this 2 relationship like the image:
3.- Result
I forgot to write 49 to value 3...
I hope you it works for you,
Best regards
- Mark as New
- Bookmark
- Subscribe
- Mute
- Subscribe to RSS Feed
- Permalink
- Report Inappropriate Content
Hi Totluy, follow this steps:
1- Add a Custon Column to concatenate NR of Groups and Groups in Arrears
2- Go to Table 2, select the first column, and unpivot other columns:
3- In the Table 2 concatenate NR + GROUP
4- In Relationship link NR+Groups of the Table 1 with NR+ Groups of the Table 2
5- Create measure:
6- Result
Best regards
- Mark as New
- Bookmark
- Subscribe
- Mute
- Subscribe to RSS Feed
- Permalink
- Report Inappropriate Content
@Bifinity_75 thank you. Because Arrears and NR of Groups are two standalone tables, I joined them on SQL table then bought in as Groups_Arrears table. I then joined the table to the Commission's one through the key, as suggested (see below).
So now I'm able to create a table visual as below, which is excellent. Thank you for your help.
- Mark as New
- Bookmark
- Subscribe
- Mute
- Subscribe to RSS Feed
- Permalink
- Report Inappropriate Content
Thank you very much @Bifinity_75 .
Your solution worked perfectly for organising my data. The only problem is I cannot concatenate table 1 as NR of Groups come from a different table to Groups in Arrears.
Helpful resources

Microsoft Fabric Learn Together
Covering the world! 9:00-10:30 AM Sydney, 4:00-5:30 PM CET (Paris/Berlin), 7:00-8:30 PM Mexico City

Power BI Monthly Update - April 2024
Check out the April 2024 Power BI update to learn about new features.

| User | Count |
|---|---|
| 109 | |
| 95 | |
| 77 | |
| 65 | |
| 53 |
| User | Count |
|---|---|
| 144 | |
| 105 | |
| 102 | |
| 89 | |
| 63 |


