- Power BI forums
- Updates
- News & Announcements
- Get Help with Power BI
- Desktop
- Service
- Report Server
- Power Query
- Mobile Apps
- Developer
- DAX Commands and Tips
- Custom Visuals Development Discussion
- Health and Life Sciences
- Power BI Spanish forums
- Translated Spanish Desktop
- Power Platform Integration - Better Together!
- Power Platform Integrations (Read-only)
- Power Platform and Dynamics 365 Integrations (Read-only)
- Training and Consulting
- Instructor Led Training
- Dashboard in a Day for Women, by Women
- Galleries
- Community Connections & How-To Videos
- COVID-19 Data Stories Gallery
- Themes Gallery
- Data Stories Gallery
- R Script Showcase
- Webinars and Video Gallery
- Quick Measures Gallery
- 2021 MSBizAppsSummit Gallery
- 2020 MSBizAppsSummit Gallery
- 2019 MSBizAppsSummit Gallery
- Events
- Ideas
- Custom Visuals Ideas
- Issues
- Issues
- Events
- Upcoming Events
- Community Blog
- Power BI Community Blog
- Custom Visuals Community Blog
- Community Support
- Community Accounts & Registration
- Using the Community
- Community Feedback
Register now to learn Fabric in free live sessions led by the best Microsoft experts. From Apr 16 to May 9, in English and Spanish.
- Power BI forums
- Forums
- Get Help with Power BI
- Desktop
- Inconsistent behaviour following a change in measu...
- Subscribe to RSS Feed
- Mark Topic as New
- Mark Topic as Read
- Float this Topic for Current User
- Bookmark
- Subscribe
- Printer Friendly Page
- Mark as New
- Bookmark
- Subscribe
- Mute
- Subscribe to RSS Feed
- Permalink
- Report Inappropriate Content
Inconsistent behaviour following a change in measure
Hi,
This is my very first post in this forum!
I am building a powerBI app to display our data to the public (not released yet, but hopefully soon). The app has multiple pages. Each page displays visuals using a different dataset. Each dataset has some columns in common (sex & grouping). The common columns are slicers tables (basically distint(table[sex]) for example), with relationships drawn to each of the main data tables (all 1 to many relationships). The common variables are linked through 'slicer tables' (e.g. slicer_sex table with 1,2 , and a label column; male/female) so that when users go from one page to the other the main selections will remain (i.e. synced).
AIM
bar chart visual with age groups on the x-axis and a value on the y-axis, according to sex (=legend).
I used to have a measure, very simple:
DX_value1 = sum(datatable1[value])
and I changed this to:
DX_value2 = if(SELECTEDVALUE(slicer_grouping_table[grouping]) = "All groups",
calculate(sum(datatable1[value]), all(slicer_grouping_table[grouping])),
sum(datatable1[value]))
I then make a bar chart of age group (X axis) vs 'DX_value'. I have a legend by sex (male/female).
ISSUE
Every since I have changed DX_value1 to DX_value2 , my visual works when I select anything other than 'All groups', but shows an empty visual (no error) when I select 'All groups'. Removing the sex legend makes it work, which leads me to believe there is a crash with the sex slicer table. Indeed, when I include sex as a legend but using datatable1[sex] instead slicer_sex_table[sex] the visual works completely. I don't understand what could possibly be wrong with my sex slicer table to get this behaviour.
Some additional points to describe why it is set up like this:
- Grouping has lots of groups + an additional row with 'All groups'. No data in table1 has 'All groups' in the grouping column. I just need this additional row as I want to have influence in the wording 'All groups'. The slicer I have on grouping is a single select slicer with >1 levels.
- I had the original simple measure set up, because actually I have two different values in table1 and I created a switch between the two.
Any help greatly appreciated!
Luc
- Mark as New
- Bookmark
- Subscribe
- Mute
- Subscribe to RSS Feed
- Permalink
- Report Inappropriate Content
Hi @LucMarv ,
Based on your description, it seems that the relationship between table schemas is affecting the filtering results. Try the formula like below:
DX_value2 =
IF (
    SELECTEDVALUE ( slicer_grouping_table[grouping] ) = "All groups",
    CALCULATE (
        SUM ( datatable1[value] ),
        ALLEXCEPT ( datatable1, table[grouping], table[SEX] )
    ),
    SUM ( datatable1[value] )
)
If the problem persists, can you provide some information about the data model screenshots, test data, etc.? This will make it easier for me to understand, so that I can answer you as soon as possible. Looking forward to your reply.
Best Regards,
Henry
If this post helps, then please consider Accept it as the solution to help the other members find it more quickly.
- Mark as New
- Bookmark
- Subscribe
- Mute
- Subscribe to RSS Feed
- Permalink
- Report Inappropriate Content
Thank you very much for your reply! Very much appreciated.
You proposed sollution was not successful, but I appreciate I did not give enough detail for you to access it all properly. So here a few screenshots of the actual application, data model etc,:
This is the data model:
- 4 'slicer' tables at the top.
- There are quite a lot of tables, most link to the 4 slicer tables (ignore the crossed out tables, they are not associated with the issue)
- T1_inc_Mort_Main is my main datatable
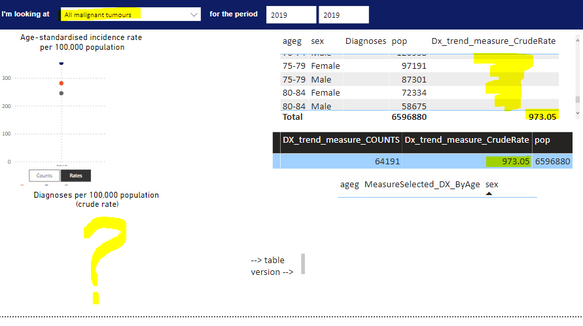
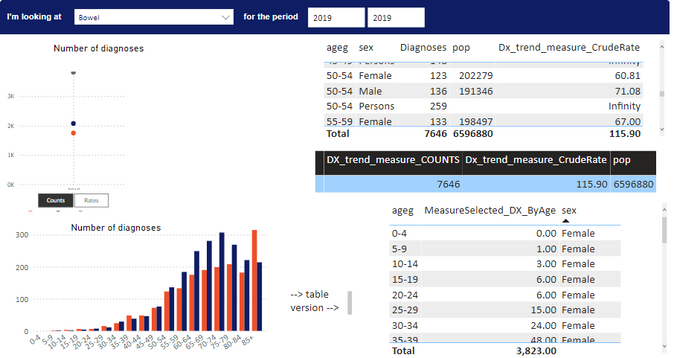
This is the front end (well, I removed most and added some tables to verify what the model is doing):
Bottom left graph is the thing that I am trying to fix. Clicking on this graph shows:
The measure in the values field reads (putting this in HTML gave an error):
MeasureSelected_DX_ByAge =
SWITCH(TRUE(),
VALUES(MeasureDimensions_dx_trend[Measure]) = "Counts", [DX_trend_measure_COUNTS],
VALUES(MeasureDimensions_dx_trend[Measure]) = "Rates", [Dx_trend_measure_CrudeRate],
BLANK())
The measure when 'Rates' is selected' is defined as:
Dx_trend_measure_CrudeRate =
if(
SELECTEDVALUE(
TumourGrouping[Grouping_Lvl1]) = "All malignant tumours",
calculate(
(sum(T1_Inc_Mort_Main[Diagnoses])/ sum(PopulationVIC[pop]))*100000,
ALLEXCEPT(T1_Inc_Mort_Main, slicer_SEX[sex], slicer_AGEG[ageg], slicer_YEAR[year])
),
(sum(T1_Inc_Mort_Main[Diagnoses])/ sum(PopulationVIC[pop]))*100000
)

Just to re-itterate, there is no data in T1_inc_Mort_main with Grouping_Lvl1] = "All malignant tumours" (not sure if that matters, but just re-itteration, just in case).
Let me know if you have other questions, or need more info.
More than happy to screenshare, which is probably a lot easier.
Regards,
Luc
Helpful resources

Microsoft Fabric Learn Together
Covering the world! 9:00-10:30 AM Sydney, 4:00-5:30 PM CET (Paris/Berlin), 7:00-8:30 PM Mexico City

Power BI Monthly Update - April 2024
Check out the April 2024 Power BI update to learn about new features.

| User | Count |
|---|---|
| 109 | |
| 98 | |
| 77 | |
| 66 | |
| 54 |
| User | Count |
|---|---|
| 144 | |
| 104 | |
| 100 | |
| 86 | |
| 64 |


