Hi @GeorgesKV,
Please be aware of your data safety.
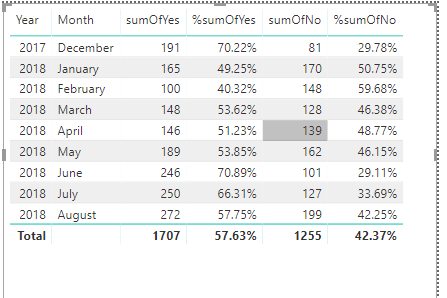
If I understand your requirements correctly, it could be done by four measures as follows. Please also check out the demo in the attachment.
sumOfYes =
CALCULATE (
    COUNTROWS ( 'PM__Time_Detail_by_Month_by_Bra' ),
    PM__Time_Detail_by_Month_by_Bra[Billable] = "Yes"
)
sumOfNo =
CALCULATE (
    COUNTROWS ( 'PM__Time_Detail_by_Month_by_Bra' ),
    PM__Time_Detail_by_Month_by_Bra[Billable] = "No"
)
%sumOfYes =
DIVIDE (
    CALCULATE (
        COUNTROWS ( 'PM__Time_Detail_by_Month_by_Bra' ),
        PM__Time_Detail_by_Month_by_Bra[Billable] = "Yes"
    ),
    CALCULATE (
        COUNTROWS ( 'PM__Time_Detail_by_Month_by_Bra' ),
        ALL ( PM__Time_Detail_by_Month_by_Bra[Billable] )
    ),
    0
)
%sumOfNo =
DIVIDE (
    CALCULATE (
        COUNTROWS ( 'PM__Time_Detail_by_Month_by_Bra' ),
        PM__Time_Detail_by_Month_by_Bra[Billable] = "No"
    ),
    CALCULATE (
        COUNTROWS ( 'PM__Time_Detail_by_Month_by_Bra' ),
        ALL ( PM__Time_Detail_by_Month_by_Bra[Billable] )
    ),
    0
)
Best Regards,
Dale
Community Support Team _ Dale
If this post helps, then please consider Accept it as the solution to help the other members find it more quickly.


