- Power BI forums
- Updates
- News & Announcements
- Get Help with Power BI
- Desktop
- Service
- Report Server
- Power Query
- Mobile Apps
- Developer
- DAX Commands and Tips
- Custom Visuals Development Discussion
- Health and Life Sciences
- Power BI Spanish forums
- Translated Spanish Desktop
- Power Platform Integration - Better Together!
- Power Platform Integrations (Read-only)
- Power Platform and Dynamics 365 Integrations (Read-only)
- Training and Consulting
- Instructor Led Training
- Dashboard in a Day for Women, by Women
- Galleries
- Community Connections & How-To Videos
- COVID-19 Data Stories Gallery
- Themes Gallery
- Data Stories Gallery
- R Script Showcase
- Webinars and Video Gallery
- Quick Measures Gallery
- 2021 MSBizAppsSummit Gallery
- 2020 MSBizAppsSummit Gallery
- 2019 MSBizAppsSummit Gallery
- Events
- Ideas
- Custom Visuals Ideas
- Issues
- Issues
- Events
- Upcoming Events
- Community Blog
- Power BI Community Blog
- Custom Visuals Community Blog
- Community Support
- Community Accounts & Registration
- Using the Community
- Community Feedback
Register now to learn Fabric in free live sessions led by the best Microsoft experts. From Apr 16 to May 9, in English and Spanish.
- Power BI forums
- Forums
- Get Help with Power BI
- Desktop
- Re: How to write DAX to filter only specific rows ...
- Subscribe to RSS Feed
- Mark Topic as New
- Mark Topic as Read
- Float this Topic for Current User
- Bookmark
- Subscribe
- Printer Friendly Page
- Mark as New
- Bookmark
- Subscribe
- Mute
- Subscribe to RSS Feed
- Permalink
- Report Inappropriate Content
How to write DAX to filter only specific rows dynamically even when data is changed in the future.
Hello Guys,
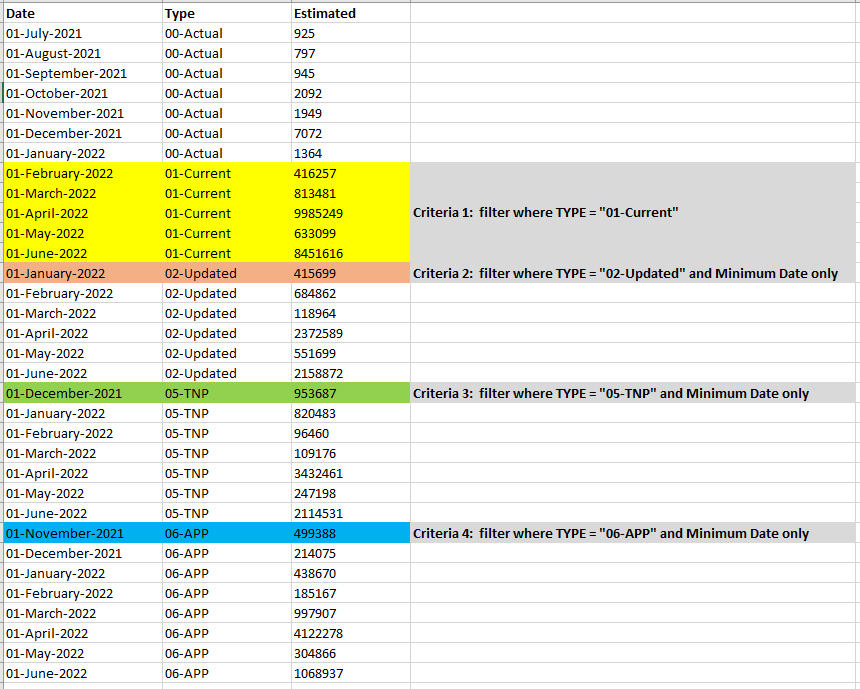
I'm trying to filter data to show the result on specific criteria from the below data dynamically even when the data gets updated but the logic should remain same..
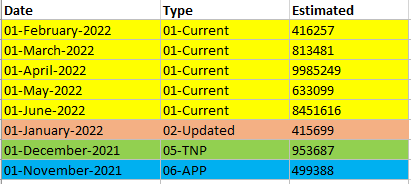
Expected Result:
I need to use line chart to show "Estimated" values from November 2021 to June 2022.
Please let me know.
Thanks in advance.
Dee
Solved! Go to Solution.
- Mark as New
- Bookmark
- Subscribe
- Mute
- Subscribe to RSS Feed
- Permalink
- Report Inappropriate Content
Hi,
Sorry for my misunderstanding.
Please try the below.
Estimated measure: =
VAR newtable =
FILTER (
SUMMARIZE ( ALL ( Data ), 'Calendar'[Date], Data[Type] ),
AND ( Data[Type] <> "Actual", Data[Type] <> "Current" )
)
VAR groupbymindate =
GROUPBY (
newtable,
Data[Type],
"@mindate", MINX ( CURRENTGROUP (), 'Calendar'[Date] )
)
VAR filter_table =
FILTER (
CALCULATETABLE ( Data, TREATAS ( groupbymindate, Data[Type], Data[Date] ) ),
Data[Type] = MAX ( Data[Type] )
&& Data[Date] IN VALUES ( 'Calendar'[Date] )
)
VAR monthyeartable =
SUMMARIZE (
ADDCOLUMNS (
SUMMARIZE ( Data, 'Calendar'[Month & Year], Data[Type] ),
"@result",
CALCULATE (
IF (
SELECTEDVALUE ( Data[Type] ) = "Current",
SUM ( Data[Estimated] ),
SUMX ( filter_table, Data[Estimated] )
)
)
),
'Calendar'[Month & Year],
[@result]
)
RETURN
IF (
HASONEVALUE ( 'Calendar'[Month & Year] ),
SUMX ( monthyeartable, [@result] )
)
If this post helps, then please consider accepting it as the solution to help other members find it faster, and give a big thumbs up.
- Mark as New
- Bookmark
- Subscribe
- Mute
- Subscribe to RSS Feed
- Permalink
- Report Inappropriate Content
Hi,
I tried to follow the concept and created a sample pbix file like attached.
Please check the below picture and the attached pbix file.
Estimated measure: =
VAR newtable =
FILTER (
SUMMARIZE ( ALL ( Data ), 'Calendar'[Date], Data[Type] ),
AND ( Data[Type] <> "Actual", Data[Type] <> "Current" )
)
VAR groupbymindate =
GROUPBY (
newtable,
Data[Type],
"@mindate", MINX ( CURRENTGROUP (), 'Calendar'[Date] )
)
VAR filter_table =
FILTER (
CALCULATETABLE ( Data, TREATAS ( groupbymindate, Data[Type], Data[Date] ) ),
Data[Type] = MAX ( Data[Type] )
&& Data[Date] IN VALUES ( 'Calendar'[Date] )
)
RETURN
IF (
HASONEVALUE ( 'Calendar'[Month & Year] ),
IF (
SELECTEDVALUE ( Data[Type] ) = "Current",
SUM ( Data[Estimated] ),
SUMX ( filter_table, Data[Estimated] )
)
)
If this post helps, then please consider accepting it as the solution to help other members find it faster, and give a big thumbs up.
- Mark as New
- Bookmark
- Subscribe
- Mute
- Subscribe to RSS Feed
- Permalink
- Report Inappropriate Content
Thank you very much @Jihwan_Kim that's a great solution.
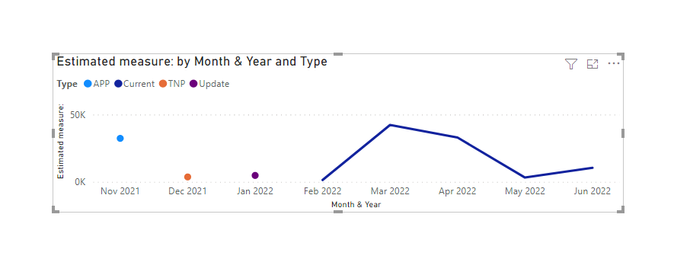
But the line chart is broken with the points. Please see below
Thanks
Dee
- Mark as New
- Bookmark
- Subscribe
- Mute
- Subscribe to RSS Feed
- Permalink
- Report Inappropriate Content
Hi,
Thank you for your feedback.
May I know how your expected result looks like?
If this post helps, then please consider accepting it as the solution to help other members find it faster, and give a big thumbs up.
- Mark as New
- Bookmark
- Subscribe
- Mute
- Subscribe to RSS Feed
- Permalink
- Report Inappropriate Content
- Mark as New
- Bookmark
- Subscribe
- Mute
- Subscribe to RSS Feed
- Permalink
- Report Inappropriate Content
Hi,
Please try to remove the legend in the linechart.
Thank you.
If this post helps, then please consider accepting it as the solution to help other members find it faster, and give a big thumbs up.
- Mark as New
- Bookmark
- Subscribe
- Mute
- Subscribe to RSS Feed
- Permalink
- Report Inappropriate Content
Hi @Jihwan_Kim
When I remove the legend that future dates are disappered.
Please see below.
Can we wrap up all the "Type" field values into one single column? is it possible?
Thanks in advance
Dee
- Mark as New
- Bookmark
- Subscribe
- Mute
- Subscribe to RSS Feed
- Permalink
- Report Inappropriate Content
Hi,
Sorry for my misunderstanding.
Please try the below.
Estimated measure: =
VAR newtable =
FILTER (
SUMMARIZE ( ALL ( Data ), 'Calendar'[Date], Data[Type] ),
AND ( Data[Type] <> "Actual", Data[Type] <> "Current" )
)
VAR groupbymindate =
GROUPBY (
newtable,
Data[Type],
"@mindate", MINX ( CURRENTGROUP (), 'Calendar'[Date] )
)
VAR filter_table =
FILTER (
CALCULATETABLE ( Data, TREATAS ( groupbymindate, Data[Type], Data[Date] ) ),
Data[Type] = MAX ( Data[Type] )
&& Data[Date] IN VALUES ( 'Calendar'[Date] )
)
VAR monthyeartable =
SUMMARIZE (
ADDCOLUMNS (
SUMMARIZE ( Data, 'Calendar'[Month & Year], Data[Type] ),
"@result",
CALCULATE (
IF (
SELECTEDVALUE ( Data[Type] ) = "Current",
SUM ( Data[Estimated] ),
SUMX ( filter_table, Data[Estimated] )
)
)
),
'Calendar'[Month & Year],
[@result]
)
RETURN
IF (
HASONEVALUE ( 'Calendar'[Month & Year] ),
SUMX ( monthyeartable, [@result] )
)
If this post helps, then please consider accepting it as the solution to help other members find it faster, and give a big thumbs up.
- Mark as New
- Bookmark
- Subscribe
- Mute
- Subscribe to RSS Feed
- Permalink
- Report Inappropriate Content
@Jihwan_Kim brilliant! 👏🙌
If I have posted a response that resolves your question, please accept it as a solution to formally close the post.
Also, if you are as passionate about Power BI, DAX and data as I am, please feel free to reach out if you have any questions, queries, or if you simply want to connect and talk to another data geek!
Want to connect?www.linkedin.com/in/theoconias
- Mark as New
- Bookmark
- Subscribe
- Mute
- Subscribe to RSS Feed
- Permalink
- Report Inappropriate Content
- Mark as New
- Bookmark
- Subscribe
- Mute
- Subscribe to RSS Feed
- Permalink
- Report Inappropriate Content
@Deeintu I think you need to remove the Legend in your line chart. I think @Jihwan_Kim has provided the right solution from what I see.
If I have posted a response that resolves your question, please accept it as a solution to formally close the post.
Also, if you are as passionate about Power BI, DAX and data as I am, please feel free to reach out if you have any questions, queries, or if you simply want to connect and talk to another data geek!
Want to connect?www.linkedin.com/in/theoconias
- Mark as New
- Bookmark
- Subscribe
- Mute
- Subscribe to RSS Feed
- Permalink
- Report Inappropriate Content
Hi @TheoC ,
When I remove the Legend then It automatically removes other future months estimates from the chart.
Please see below.
Thanks
Dee
- Mark as New
- Bookmark
- Subscribe
- Mute
- Subscribe to RSS Feed
- Permalink
- Report Inappropriate Content
@Deeintu , Create a measure like
Calculate(Sum(Table[Estimate]), filter(Table, Table[Date] = minx(filter(allselected(Table), Table[Type] = max(Table[Type])),[Date]) && Table[Type] in {"02-Update", "05-TNP", "06-APP")) + Calculate(Sum(Table[Estimate]), filter(Table, Table[Type] = "01-Current"))
Microsoft Power BI Learning Resources, 2023 !!
Learn Power BI - Full Course with Dec-2022, with Window, Index, Offset, 100+ Topics !!
Did I answer your question? Mark my post as a solution! Appreciate your Kudos !! Proud to be a Super User! !!
- Mark as New
- Bookmark
- Subscribe
- Mute
- Subscribe to RSS Feed
- Permalink
- Report Inappropriate Content
Hi @amitchandak
Thank you very much for the response.
I'm getting below error in the DAX calculation.
Thanks
Dee
Helpful resources

Microsoft Fabric Learn Together
Covering the world! 9:00-10:30 AM Sydney, 4:00-5:30 PM CET (Paris/Berlin), 7:00-8:30 PM Mexico City

Power BI Monthly Update - April 2024
Check out the April 2024 Power BI update to learn about new features.

| User | Count |
|---|---|
| 109 | |
| 98 | |
| 77 | |
| 66 | |
| 54 |
| User | Count |
|---|---|
| 144 | |
| 104 | |
| 100 | |
| 86 | |
| 64 |


