- Power BI forums
- Updates
- News & Announcements
- Get Help with Power BI
- Desktop
- Service
- Report Server
- Power Query
- Mobile Apps
- Developer
- DAX Commands and Tips
- Custom Visuals Development Discussion
- Health and Life Sciences
- Power BI Spanish forums
- Translated Spanish Desktop
- Power Platform Integration - Better Together!
- Power Platform Integrations (Read-only)
- Power Platform and Dynamics 365 Integrations (Read-only)
- Training and Consulting
- Instructor Led Training
- Dashboard in a Day for Women, by Women
- Galleries
- Community Connections & How-To Videos
- COVID-19 Data Stories Gallery
- Themes Gallery
- Data Stories Gallery
- R Script Showcase
- Webinars and Video Gallery
- Quick Measures Gallery
- 2021 MSBizAppsSummit Gallery
- 2020 MSBizAppsSummit Gallery
- 2019 MSBizAppsSummit Gallery
- Events
- Ideas
- Custom Visuals Ideas
- Issues
- Issues
- Events
- Upcoming Events
- Community Blog
- Power BI Community Blog
- Custom Visuals Community Blog
- Community Support
- Community Accounts & Registration
- Using the Community
- Community Feedback
Register now to learn Fabric in free live sessions led by the best Microsoft experts. From Apr 16 to May 9, in English and Spanish.
- Power BI forums
- Forums
- Get Help with Power BI
- Desktop
- How to summarise number of customers by usage
- Subscribe to RSS Feed
- Mark Topic as New
- Mark Topic as Read
- Float this Topic for Current User
- Bookmark
- Subscribe
- Printer Friendly Page
- Mark as New
- Bookmark
- Subscribe
- Mute
- Subscribe to RSS Feed
- Permalink
- Report Inappropriate Content
How to summarise number of customers by usage
How do I summarise the number of customers by the number of times they have used a service?
The data is unique to customer level, including a unique ID. Therefore if they have used a service three times, they will appear in the data set as three rows. This is an example of the sort of graph I'd like to create:
However, to do this so far, I have had to summarise the data as a view using SQL and isolating this dataset from the model, but it would be more efficient and useful to be able to do this in Power BI Desktop.
Ideally I'd like to keep the data as it is because there are dimension IDs that link to customers information, such as City or Job that may change each time they use the service, so I need to be able to retain that dimension ID.
Many thanks in advance
- Mark as New
- Bookmark
- Subscribe
- Mute
- Subscribe to RSS Feed
- Permalink
- Report Inappropriate Content
Hi @KWB,
Suppose your data view looks like:
To achieve your requirement, please first create a calculated column using below DAX formula:
Number of Times =
CALCULATE (
    COUNT ( summarise[Customer ID] ),
    ALLEXCEPT ( summarise, summarise[Customer ID] )
)
In visual, drag this new column into Axis setion and drag [Customer ID] into value section. Please be aware that you should select Count(distinct) from drop down list.
Best regards,
Yuliana Gu
If this post helps, then please consider Accept it as the solution to help the other members find it more quickly.
- Mark as New
- Bookmark
- Subscribe
- Mute
- Subscribe to RSS Feed
- Permalink
- Report Inappropriate Content
@v-yulgu-msft wrote:Hi @KWB,
Suppose your data view looks like:
To achieve your requirement, please first create a calculated column using below DAX formula:
Number of Times =
CALCULATE (
    COUNT ( summarise[Customer ID] ),
    ALLEXCEPT ( summarise, summarise[Customer ID] )
)
In visual, drag this new column into Axis setion and drag [Customer ID] into value section. Please be aware that you should select Count(distinct) from drop down list.
Best regards,
Yuliana Gu
Thanks Yuliana, it works as a total of the table. For example, one customer might have a total of 6 uses of the service across two years, say 3 in 2015 and 3 in 2016. If a year is selected, the uses still stays at 6 rather than three, so it doesn't seem possible to segment the total of the table.
- Mark as New
- Bookmark
- Subscribe
- Mute
- Subscribe to RSS Feed
- Permalink
- Report Inappropriate Content
Hi @KWB,
In my test, the count values will also change depend on the selection of year from slicer.
Would you please share your sample data so that I can test for you?
Regards,
Yuliana Gu
If this post helps, then please consider Accept it as the solution to help the other members find it more quickly.
- Mark as New
- Bookmark
- Subscribe
- Mute
- Subscribe to RSS Feed
- Permalink
- Report Inappropriate Content
Thanks for your time, @v-yulgu-msft:
I created a very basic set of test data:
If I use your calculation, the whole table works:
Customer1, Customer3 and Customer4 have used it one time and Customer2 has used it two times.
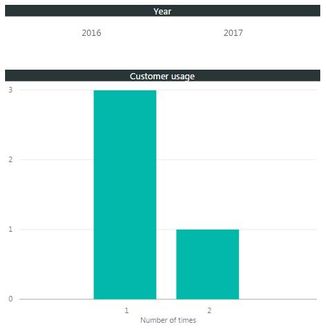
The problem is when I select a filter (in this example, year is in the main table, but in reality is in a calendar dimension):
For 2016, Customer2 has used it once, Customer4 has used it once. But the data shows one customer has used it once and once customer has used it twice. I suspect the latter is because Customer4 appears twice in the whole table and selecting 2016 doesn't affect that.
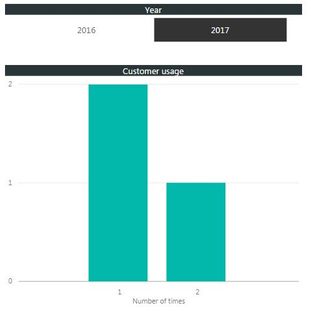
For 2017, Customer1, Customer2 and Customer3 have used the service once. Again, Customer 2 seems to be counted twice, rather than once.
Hope that makes sense? Thanks for your assistance.
Regards
- Mark as New
- Bookmark
- Subscribe
- Mute
- Subscribe to RSS Feed
- Permalink
- Report Inappropriate Content
Hi,
for me it looks like a job for the custom visual (Histogram)
Another solution for histograms can be seen here.
https://powerbi.microsoft.com/en-us/documentation/powerbi-service-histograms/
Maybe it helps
Helpful resources

Microsoft Fabric Learn Together
Covering the world! 9:00-10:30 AM Sydney, 4:00-5:30 PM CET (Paris/Berlin), 7:00-8:30 PM Mexico City

Power BI Monthly Update - April 2024
Check out the April 2024 Power BI update to learn about new features.

| User | Count |
|---|---|
| 114 | |
| 100 | |
| 75 | |
| 73 | |
| 49 |
| User | Count |
|---|---|
| 145 | |
| 109 | |
| 109 | |
| 90 | |
| 64 |


