- Power BI forums
- Updates
- News & Announcements
- Get Help with Power BI
- Desktop
- Service
- Report Server
- Power Query
- Mobile Apps
- Developer
- DAX Commands and Tips
- Custom Visuals Development Discussion
- Health and Life Sciences
- Power BI Spanish forums
- Translated Spanish Desktop
- Power Platform Integration - Better Together!
- Power Platform Integrations (Read-only)
- Power Platform and Dynamics 365 Integrations (Read-only)
- Training and Consulting
- Instructor Led Training
- Dashboard in a Day for Women, by Women
- Galleries
- Community Connections & How-To Videos
- COVID-19 Data Stories Gallery
- Themes Gallery
- Data Stories Gallery
- R Script Showcase
- Webinars and Video Gallery
- Quick Measures Gallery
- 2021 MSBizAppsSummit Gallery
- 2020 MSBizAppsSummit Gallery
- 2019 MSBizAppsSummit Gallery
- Events
- Ideas
- Custom Visuals Ideas
- Issues
- Issues
- Events
- Upcoming Events
- Community Blog
- Power BI Community Blog
- Custom Visuals Community Blog
- Community Support
- Community Accounts & Registration
- Using the Community
- Community Feedback
Register now to learn Fabric in free live sessions led by the best Microsoft experts. From Apr 16 to May 9, in English and Spanish.
- Power BI forums
- Forums
- Get Help with Power BI
- Desktop
- Re: How to set the background to red if in Top 10 ...
- Subscribe to RSS Feed
- Mark Topic as New
- Mark Topic as Read
- Float this Topic for Current User
- Bookmark
- Subscribe
- Printer Friendly Page
- Mark as New
- Bookmark
- Subscribe
- Mute
- Subscribe to RSS Feed
- Permalink
- Report Inappropriate Content
How to set the background to red if in Top 10 with Ties, dynamically by slicer?
Hi,
I have the below Table visual that has the branch in the first column and the compliance percentage in the second column. The compliance is dynamically calculated based on the period the user selects. For example, the below screenshot shows visual when the user has slected 'latest working day'.
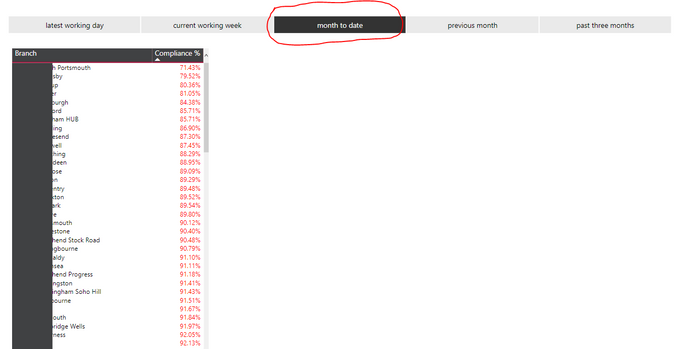
If the user then selected the 'month to date' period the values will reflect this. See below.
Notice how the values change and the order of the branches too. There is conditional formatting set against the font of the Compliance % to be red when under 95%.
The DAX that caters for the dynamically selected Compliance % values is below:
VAR __PeriodSelected = SELECTEDVALUE( Period[Period] )
VAR __Year = YEAR( TODAY() )
VAR __Month = MONTH( TODAY() )
RETURN
SWITCH( __PeriodSelected
, "latest working day"
, CALCULATE(
AVERAGE( Query_Branches_All[Compliance %] ),
FILTER( 'Date', 'Date'[Date] = MAX( 'Date'[Date] ) )
)
, "current working week"
, CALCULATE(
AVERAGE( Query_Branches_All[Compliance %] ),
FILTER( 'Date', WEEKNUM( 'Date'[Date], 2 ) = WEEKNUM( TODAY() ) )
)
, "month to date"
, CALCULATE(
AVERAGE( Query_Branches_All[Compliance %] ),
FILTER( 'Date', 'Date'[Year] = __Year ),
FILTER( 'Date', 'Date'[Month Number] = __Month )
)
, "previous month"
, CALCULATE(
AVERAGE( Query_Branches_All[Compliance %] ),
DATESBETWEEN( 'Date'[Date], EOMONTH( TODAY(), -2 ) +1, EOMONTH( TODAY(), -1 ) )
)
, "past three months"
, CALCULATE(
AVERAGE( Query_Branches_All[Compliance %] ),
ALL( 'Date'[Date] )
)
)
What I require is that the background of the Branch column is set to red if that branch is in the Top 10 (not Top 10 percent) just the Top 10 in the list. I would like ties included in this. The Top 10 is the lowest percentage value (see my ordering - it is ordered in the lowest first).
I will need this Top 10 (with ties) dynamically calculated based on the period selection the user chose.
I see the first part if the DAX to rank the Top 10 dynamically - how do I do this?
The second part is how to set the background colour to red in the Table visual, but this is dependant on getting the clever DAX right.
Using the DAX I have inserted into this post, I have tried ADDCOLUMNS/SUMMARIZE functions outside of the SWITCH and using the CALCULATE as the add column part. I have attempted to embed a ADDCOLUMNS/SUMMARIZE inside each SWITCH case. All to no avail.
Please can someone help me with this?
Thanks.
- Mark as New
- Bookmark
- Subscribe
- Mute
- Subscribe to RSS Feed
- Permalink
- Report Inappropriate Content
First, please see this post regarding How to Get Your Question Answered Quickly: https://community.powerbi.com/t5/Community-Blog/How-to-Get-Your-Question-Answered-Quickly/ba-p/38490
That being said, you should be able to create a measure like this:
Measure =
VAR __branch = MAX([Branch])
VAR __table = SUMMARIZE('Table',[Branch],"__compliance%",[Compliance %])
VAR __table1 = TOPN(10,__table,[__compliance%],0)
VAR __table2 = FILTER(__table1,[Branch]=__branch)
RETURN
IF(COUNTROWS(__table2)>0,1,0) //1 is red (included)
@ me in replies or I'll lose your thread!!!
Instead of a Kudo, please vote for this idea
Become an expert!: Enterprise DNA
External Tools: MSHGQM
YouTube Channel!: Microsoft Hates Greg
Latest book!: The Definitive Guide to Power Query (M)
DAX is easy, CALCULATE makes DAX hard...
Helpful resources

Microsoft Fabric Learn Together
Covering the world! 9:00-10:30 AM Sydney, 4:00-5:30 PM CET (Paris/Berlin), 7:00-8:30 PM Mexico City

Power BI Monthly Update - April 2024
Check out the April 2024 Power BI update to learn about new features.

| User | Count |
|---|---|
| 112 | |
| 97 | |
| 84 | |
| 67 | |
| 60 |
| User | Count |
|---|---|
| 150 | |
| 120 | |
| 99 | |
| 87 | |
| 68 |


