- Power BI forums
- Updates
- News & Announcements
- Get Help with Power BI
- Desktop
- Service
- Report Server
- Power Query
- Mobile Apps
- Developer
- DAX Commands and Tips
- Custom Visuals Development Discussion
- Health and Life Sciences
- Power BI Spanish forums
- Translated Spanish Desktop
- Power Platform Integration - Better Together!
- Power Platform Integrations (Read-only)
- Power Platform and Dynamics 365 Integrations (Read-only)
- Training and Consulting
- Instructor Led Training
- Dashboard in a Day for Women, by Women
- Galleries
- Community Connections & How-To Videos
- COVID-19 Data Stories Gallery
- Themes Gallery
- Data Stories Gallery
- R Script Showcase
- Webinars and Video Gallery
- Quick Measures Gallery
- 2021 MSBizAppsSummit Gallery
- 2020 MSBizAppsSummit Gallery
- 2019 MSBizAppsSummit Gallery
- Events
- Ideas
- Custom Visuals Ideas
- Issues
- Issues
- Events
- Upcoming Events
- Community Blog
- Power BI Community Blog
- Custom Visuals Community Blog
- Community Support
- Community Accounts & Registration
- Using the Community
- Community Feedback
Register now to learn Fabric in free live sessions led by the best Microsoft experts. From Apr 16 to May 9, in English and Spanish.
- Power BI forums
- Forums
- Get Help with Power BI
- Desktop
- Re: How to order calendar months for data of diffe...
- Subscribe to RSS Feed
- Mark Topic as New
- Mark Topic as Read
- Float this Topic for Current User
- Bookmark
- Subscribe
- Printer Friendly Page
- Mark as New
- Bookmark
- Subscribe
- Mute
- Subscribe to RSS Feed
- Permalink
- Report Inappropriate Content
How to order calendar months for data of different financial year periods
Hello Power BI community
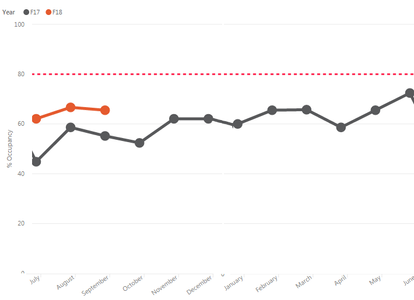
I am trying to developing a visual to show last year (F17) and this year's (F18) data on a line graph. I am stuck on how to sort my axis from July to June. What it currently looks like:
What I want it to look like:
I have had a look around to forum to find that suggestions to solve similar problems involve making a 'sorting column', however I'm quite confused about how to make July, regardless of Year = 1. Can anyone offer some advice on how best to make this work? A sample of my data below. Any suggestions appreciated!
Solved! Go to Solution.
- Mark as New
- Bookmark
- Subscribe
- Mute
- Subscribe to RSS Feed
- Permalink
- Report Inappropriate Content
Hi @KeepCalm007,
You can create a calculated column below:
FiscalMonth = SWITCH(MONTH('Table1'[Month]),7,1,8,2,9,3,10,4,11,5,12,6,1,7,2,8,3,9,4,10,5,11,6,12)
Then place this column to the chart Tooltips section, and set as MAX aggregation. Go to the chart, set it's sort by this column. For details, you can download attached pbix file.
Best Regards,
Qiuyun Yu
If this post helps, then please consider Accept it as the solution to help the other members find it more quickly.
- Mark as New
- Bookmark
- Subscribe
- Mute
- Subscribe to RSS Feed
- Permalink
- Report Inappropriate Content
Thank you @v-qiuyu-msft for your solution, it works for me. However, the Max of Fiscal Month always appear in the chart title automatically, do you have any solution for this name doesnt appear in the chart tittle?
Thank you for your answer
- Mark as New
- Bookmark
- Subscribe
- Mute
- Subscribe to RSS Feed
- Permalink
- Report Inappropriate Content
Thank you both @GilbertQ and @v-qiuyu-msft for your ideas.
I used your solution @v-qiuyu-msft and it worked,eventually!
- For a while it wasn't working, I think there may be a bug with my 'Sort by', as it wouldn't do Ascending sort order correctly for a while, I almost gave up!
Thank you very much for the tips
- Mark as New
- Bookmark
- Subscribe
- Mute
- Subscribe to RSS Feed
- Permalink
- Report Inappropriate Content
Hi @KeepCalm007
What I can suggest doing is to create a Date table. In this Date table you can have Calendar Month's and Fiscal Months.
Then what you can have is the Fiscal Month sorted by the Fiscal Start month, which will give you what you are looking for.
Then instead of using the Calendar Month in your visual you just use the Fiscal Month.
You can find my blog post here explaining on how to create your Date table, which once configured will already have the Fiscal Month Sort Order done for you: https://www.fourmoo.com/2016/09/13/power-bi-how-to-easily-create-dynamic-date-tabledimension-with-fi...
Helpful resources

Microsoft Fabric Learn Together
Covering the world! 9:00-10:30 AM Sydney, 4:00-5:30 PM CET (Paris/Berlin), 7:00-8:30 PM Mexico City

Power BI Monthly Update - April 2024
Check out the April 2024 Power BI update to learn about new features.

| User | Count |
|---|---|
| 106 | |
| 93 | |
| 75 | |
| 62 | |
| 50 |
| User | Count |
|---|---|
| 147 | |
| 107 | |
| 105 | |
| 87 | |
| 61 |


