- Power BI forums
- Updates
- News & Announcements
- Get Help with Power BI
- Desktop
- Service
- Report Server
- Power Query
- Mobile Apps
- Developer
- DAX Commands and Tips
- Custom Visuals Development Discussion
- Health and Life Sciences
- Power BI Spanish forums
- Translated Spanish Desktop
- Power Platform Integration - Better Together!
- Power Platform Integrations (Read-only)
- Power Platform and Dynamics 365 Integrations (Read-only)
- Training and Consulting
- Instructor Led Training
- Dashboard in a Day for Women, by Women
- Galleries
- Community Connections & How-To Videos
- COVID-19 Data Stories Gallery
- Themes Gallery
- Data Stories Gallery
- R Script Showcase
- Webinars and Video Gallery
- Quick Measures Gallery
- 2021 MSBizAppsSummit Gallery
- 2020 MSBizAppsSummit Gallery
- 2019 MSBizAppsSummit Gallery
- Events
- Ideas
- Custom Visuals Ideas
- Issues
- Issues
- Events
- Upcoming Events
- Community Blog
- Power BI Community Blog
- Custom Visuals Community Blog
- Community Support
- Community Accounts & Registration
- Using the Community
- Community Feedback
Register now to learn Fabric in free live sessions led by the best Microsoft experts. From Apr 16 to May 9, in English and Spanish.
- Power BI forums
- Forums
- Get Help with Power BI
- Desktop
- How to display item with no data in the Radar Char...
- Subscribe to RSS Feed
- Mark Topic as New
- Mark Topic as Read
- Float this Topic for Current User
- Bookmark
- Subscribe
- Printer Friendly Page
- Mark as New
- Bookmark
- Subscribe
- Mute
- Subscribe to RSS Feed
- Permalink
- Report Inappropriate Content
How to display item with no data in the Radar Chart (Radar Chart 2.0.2) ?
Hi
In my radar chart (i downloaded from the app store - Radar 2.0.2 ), in the normal case, I should have all five areas of focus for the training participants. However, when I select one person out from the list, it will not show all five areas of focus but it only shows some areas of focus. But I want to have those areas of focus with no value. I tried to use
Without selecting the name of participants, this radar chart will show all 5 areas of focus.
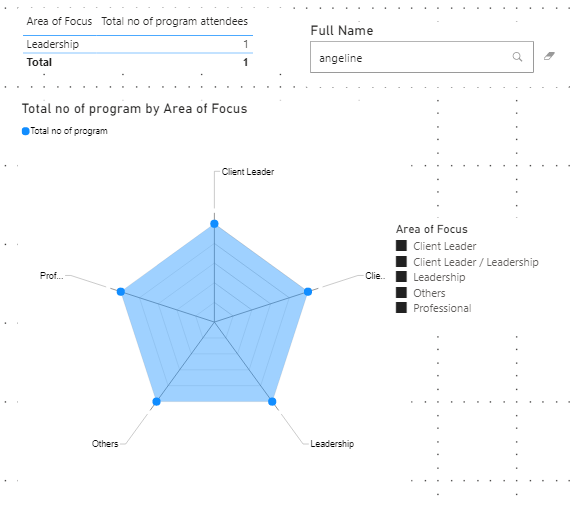
When selecting a participant from the full list,
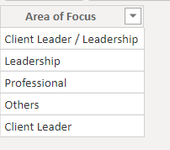
So I tried to check the website to see whether I can find any solution to it and I found this solution like this below. This feature allows you to show items with no values. However, in Radar 2.0.2, it does not have such a field that allows me to show the items with no values.
In Radar 2.0.2 app, there is no feature that allows me to show items with no value.
Summary
Is there anyone who is familiar with Radar Chart and I need help for this part? Or is there any better type of free version of Radar Chart that allows me to show items with no value as well? Or I need to do something to the data modelling diagram like many to one, one to many...?
Solved! Go to Solution.
- Mark as New
- Bookmark
- Subscribe
- Mute
- Subscribe to RSS Feed
- Permalink
- Report Inappropriate Content
Hi @Anonymous ,
We create a sample model like yours.
Then we have slightly modified the original Measure.
Measure =
var _select = VALUES('Slicer table'[Area of Focus])
return
IF(
    ISFILTERED('Slicer table'[Area of Focus]),
    CALCULATE(DISTINCTCOUNT('Program Table'[Program ID]),FILTER('Framework table','Framework table'[Area of Focus] in _select))+0,1)
Please check the pbix file below.
Best regards,
Community Support Team _ zhenbw
If this post helps, then please consider Accept it as the solution to help the other members find it more quickly.
- Mark as New
- Bookmark
- Subscribe
- Mute
- Subscribe to RSS Feed
- Permalink
- Report Inappropriate Content
Finally it works. Thanks so much for your patience and taking so much time and effort to guide me along! I believe this post will be very invaluable to others who want to display other items with no values.
- Mark as New
- Bookmark
- Subscribe
- Mute
- Subscribe to RSS Feed
- Permalink
- Report Inappropriate Content
Hi @Anonymous ,
We create a sample model like yours.
Then we have slightly modified the original Measure.
Measure =
var _select = VALUES('Slicer table'[Area of Focus])
return
IF(
    ISFILTERED('Slicer table'[Area of Focus]),
    CALCULATE(DISTINCTCOUNT('Program Table'[Program ID]),FILTER('Framework table','Framework table'[Area of Focus] in _select))+0,1)
Please check the pbix file below.
Best regards,
Community Support Team _ zhenbw
If this post helps, then please consider Accept it as the solution to help the other members find it more quickly.
- Mark as New
- Bookmark
- Subscribe
- Mute
- Subscribe to RSS Feed
- Permalink
- Report Inappropriate Content
Hi @Anonymous ,
Which tables does your full name column belong to?
Do you have a relationship between Framework table and Program table?
If they have a relationship based on Program ID, you can try the following measure.
Measure =
var _select = VALUES('Slicer table'[Area of Focus])
return
IF(
    ISFILTERED('Slicer table'[Area of Focus]),
    CALCULATE(DISTINCTCOUNT('Framework table'[Program ID]),FILTER('Framework table','Framework table'[Area of Focus] in _select))+0,1)
If it doesn’t meet your requirement, could you please provide a mockup sample based on fake data?
It will be helpful if you can show us the exact expected result based on the tables.
Please upload your files to OneDrive For Business and share the link here. Please don't contain any Confidential Information or Real data in your reply.
Best regards,
Community Support Team _ zhenbw
If this post helps, then please consider Accept it as the solution to help the other members find it more quickly.
BTW, pbix as attached.
- Mark as New
- Bookmark
- Subscribe
- Mute
- Subscribe to RSS Feed
- Permalink
- Report Inappropriate Content
Thanks. It seems that I could not attach the sample pbi dashboard with mock data which is similar to my actual data. Anyway I will attach all the screen shots of my mock data here.
As for the full name, it actually belongs to another table which is called participant table.
Program Table, I added some additional info
I have created the new table for participant table and pls refer to the screen shot. Even if I created the table, the output is not quite correct.
- Mark as New
- Bookmark
- Subscribe
- Mute
- Subscribe to RSS Feed
- Permalink
- Report Inappropriate Content
I realise that I did not show you the Framework table. Pls find the Framework table below. It contains the list of all unique programmes with areas of focus, program ID, etc.
After creating the new measure, I added in these fields for Radar Chart and that is how I obtained the output.
Perhaps I may use the wrong fields and please kindly enlighten me.
Thanks
- Mark as New
- Bookmark
- Subscribe
- Mute
- Subscribe to RSS Feed
- Permalink
- Report Inappropriate Content
Thanks. But I still could not get the right output though I manage to get all items displayed.
When I select Angeline she has taken only one course that allows her to work on her leadership quality. So the radar chart should show one point for Leadership while the rest should not show any value.
My workings are shown as below:
Then I created a new measure:
- Mark as New
- Bookmark
- Subscribe
- Mute
- Subscribe to RSS Feed
- Permalink
- Report Inappropriate Content
Hi @Anonymous ,
We can create a table and a measure to meet your requirement.
1. Create a distinct program name table. Note: there is no relationship.
Slicer table = VALUES('Table'[Program Name])
2. Then we can create a measure. (The slicer used the Program Name in Slicer table.)
Measure =
var _select = VALUES('Slicer table'[Program Name])
return
IF(
    ISFILTERED('Slicer table'[Program Name]),
    CALCULATE(DISTINCTCOUNT('Table'[Program ID]),FILTER('Table','Table'[Program Name] in _select))+0,1)
If it doesn’t meet your requirement, could you please show the exact expected result based on the table that you have shared?
Best regards,
Community Support Team _ zhenbw
If this post helps, then please consider Accept it as the solution to help the other members find it more quickly.
BTW, pbix as attached.
- Mark as New
- Bookmark
- Subscribe
- Mute
- Subscribe to RSS Feed
- Permalink
- Report Inappropriate Content
Have you tried adding zero to your measure, so that it is never blank? That usually gives the same effect as Show Items with No Data.
Regards,
Pat
Did I answer your question? Mark my post as a solution! Kudos are also appreciated!
To learn more about Power BI, follow me on Twitter or subscribe on YouTube.
@mahoneypa HoosierBI on YouTube
- Mark as New
- Bookmark
- Subscribe
- Mute
- Subscribe to RSS Feed
- Permalink
- Report Inappropriate Content
Hi Pat,
I think I may have misread your question. There is no blank field in my case. It is just that the program table contains all the programs taken by participants whilst the framework table contains full list of programs with accompanying areas of focus. So if participant A has taken 3 programs then the radar chart can only show the area of focus based on what he has taken. It will not show any other programs that he did not take. But we want to include the program that he did not take to reflect that he has not achieved that particular area of focus.
- Mark as New
- Bookmark
- Subscribe
- Mute
- Subscribe to RSS Feed
- Permalink
- Report Inappropriate Content
No added rows needed. Use a column from our Framework table as the legend in the radar chart, then make a measure like this for the values
ProgramCount = COUNT(Program[Email Address]) + 0
or use DISTINCTCOUNT if someone may have taken it more than once.
Regards,
Pat
Did I answer your question? Mark my post as a solution! Kudos are also appreciated!
To learn more about Power BI, follow me on Twitter or subscribe on YouTube.
@mahoneypa HoosierBI on YouTube
- Mark as New
- Bookmark
- Subscribe
- Mute
- Subscribe to RSS Feed
- Permalink
- Report Inappropriate Content
Hi Pat
thanks for your suggestion. There is no legend provided in radar chart 2.02. Only category and y-axis.
I thought that it shld be the total no of programs against area of focus?
As for the total no of program, it is as :
- Mark as New
- Bookmark
- Subscribe
- Mute
- Subscribe to RSS Feed
- Permalink
- Report Inappropriate Content
Hi Pat thanks for your prompt response. I did think of it since there is no functionality that allows me to show items with no values.
I have two separate tables with mock data:
1) Program table (those programs have been taken by participants)
2) Framework table (list of all programs with areas of focuses)
Program Table (sample data)
--------------------
Email address | Program ID | Name of Program
aaa@b.com PG01 How to be a leader
aaa@b.com PG02 How to present
aaa@b.com PG03 Diversity
Framework table (sample data)
---------------------------------
Program ID | Program Name | Area of Focus
PG01 How to be leader Leadership
PG02 How to present Communication
PG03 Diversity Motivation
PG04 Relationship Client relationship
PG05 Teambuilding Professional
So based on your suggestion, should I need to create additional rows in Program Table to match against the Framework table? I can see that it will create a lot of work as I have more than 1000 records in both tables.
Thanks!
Helpful resources

Microsoft Fabric Learn Together
Covering the world! 9:00-10:30 AM Sydney, 4:00-5:30 PM CET (Paris/Berlin), 7:00-8:30 PM Mexico City

Power BI Monthly Update - April 2024
Check out the April 2024 Power BI update to learn about new features.

| User | Count |
|---|---|
| 111 | |
| 100 | |
| 80 | |
| 64 | |
| 58 |
| User | Count |
|---|---|
| 146 | |
| 110 | |
| 93 | |
| 84 | |
| 67 |


