- Power BI forums
- Updates
- News & Announcements
- Get Help with Power BI
- Desktop
- Service
- Report Server
- Power Query
- Mobile Apps
- Developer
- DAX Commands and Tips
- Custom Visuals Development Discussion
- Health and Life Sciences
- Power BI Spanish forums
- Translated Spanish Desktop
- Power Platform Integration - Better Together!
- Power Platform Integrations (Read-only)
- Power Platform and Dynamics 365 Integrations (Read-only)
- Training and Consulting
- Instructor Led Training
- Dashboard in a Day for Women, by Women
- Galleries
- Community Connections & How-To Videos
- COVID-19 Data Stories Gallery
- Themes Gallery
- Data Stories Gallery
- R Script Showcase
- Webinars and Video Gallery
- Quick Measures Gallery
- 2021 MSBizAppsSummit Gallery
- 2020 MSBizAppsSummit Gallery
- 2019 MSBizAppsSummit Gallery
- Events
- Ideas
- Custom Visuals Ideas
- Issues
- Issues
- Events
- Upcoming Events
- Community Blog
- Power BI Community Blog
- Custom Visuals Community Blog
- Community Support
- Community Accounts & Registration
- Using the Community
- Community Feedback
Register now to learn Fabric in free live sessions led by the best Microsoft experts. From Apr 16 to May 9, in English and Spanish.
- Power BI forums
- Forums
- Get Help with Power BI
- Desktop
- Re: How to count distinct values in a column?
- Subscribe to RSS Feed
- Mark Topic as New
- Mark Topic as Read
- Float this Topic for Current User
- Bookmark
- Subscribe
- Printer Friendly Page
- Mark as New
- Bookmark
- Subscribe
- Mute
- Subscribe to RSS Feed
- Permalink
- Report Inappropriate Content
How to count distinct values in a column?
Hello,
How can I count distinct values in one column? For example this column has max. 5 options.
Customer demand,Monthly recurrent revenue,Innovation,Scalability & Flexibility,Efficiency separated by ( , )
Customer demand,Monthly recurrent revenue,Innovation,Scalability & Flexibility,Efficiency
Customer demand,Monthly recurrent revenue,Innovation,Scalability & Flexibility,Efficiency
Customer demand,Innovation,Efficiency
Innovation,Scalability & Flexibility,Efficiency
Monthly recurrent revenue,Innovation
Monthly recurrent revenue,Innovation
Monthly recurrent revenue,Innovation,Scalability & Flexibility
The sum should be:
Customer demand = 3
Monthly recurrent revenue = 5
Innovation = 7
Scalability & Flexibility = 4
Efficiency = 4
Kind regards, Patrick
Solved! Go to Solution.
- Mark as New
- Bookmark
- Subscribe
- Mute
- Subscribe to RSS Feed
- Permalink
- Report Inappropriate Content
Hi patrick-keen,
Select all of the columns and click Unpivot before step 1 above, steps left are same with above.
Regards,
Jimmy Tao
- Mark as New
- Bookmark
- Subscribe
- Mute
- Subscribe to RSS Feed
- Permalink
- Report Inappropriate Content
Hi patrick-keen ,
Please refer to steps below:
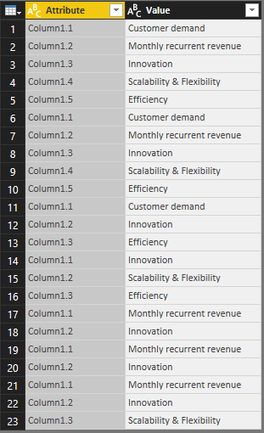
1.Click Query Editor-> Split Column by Delimiter->Select Comma as a delimiter. Result is like this:

2.Select column1.1 column1.2 column1.3 column1.4 column1.5-> Click Transform-> Unpivot Columns

3.After applied&close, create a measure using DAX like this:
Result = COUNTROWS(Table1)

PBIX file here: https://www.dropbox.com/s/6q124z4g1344796/patrick-keen.pbix?dl=0
Regards,
Jimmy Tao
- Mark as New
- Bookmark
- Subscribe
- Mute
- Subscribe to RSS Feed
- Permalink
- Report Inappropriate Content
Hello Jimmy,
this works fine for one column, but I have multiple columns with distinct values and than it doesn't work.
Do you have any solutions for this? Thank you in advanced.
Kind regards,
Patrick Oude Scholten
- Mark as New
- Bookmark
- Subscribe
- Mute
- Subscribe to RSS Feed
- Permalink
- Report Inappropriate Content
Hi patrick-keen,
Select all of the columns and click Unpivot before step 1 above, steps left are same with above.
Regards,
Jimmy Tao
- Mark as New
- Bookmark
- Subscribe
- Mute
- Subscribe to RSS Feed
- Permalink
- Report Inappropriate Content
Hello Jimmy,
I used a part of your solution and added additional querys/tables in Power BI to split them.
Thanks for helping me out.
Kind regards,
Patrick Oude Scholten
- Mark as New
- Bookmark
- Subscribe
- Mute
- Subscribe to RSS Feed
- Permalink
- Report Inappropriate Content
- Mark as New
- Bookmark
- Subscribe
- Mute
- Subscribe to RSS Feed
- Permalink
- Report Inappropriate Content
@patrick-keen wrote:Hello,
How can I count distinct values in one column?
Does DISTINCTCOUNT not give you what you want?
- Mark as New
- Bookmark
- Subscribe
- Mute
- Subscribe to RSS Feed
- Permalink
- Report Inappropriate Content
Can you give an example?
Table values:
Customer demand,Monthly recurrent revenue,Innovation,Scalability & Flexibility,Efficiency
Customer demand,Monthly recurrent revenue,Innovation,Scalability & Flexibility,Efficiency
Customer demand,Innovation,Efficiency
Innovation,Scalability & Flexibility,Efficiency
Monthly recurrent revenue,Innovation
Monthly recurrent revenue,Innovation
Monthly recurrent revenue,Innovation,Scalability & Flexibility
for example:
Customer demand the sum should be 3
Monthly recurrent revenue the sum should be 5
Innovation the sum should be 7
Scalability & Flexibility the sum should be 4
Efficiency the sum should be 4
Helpful resources

Microsoft Fabric Learn Together
Covering the world! 9:00-10:30 AM Sydney, 4:00-5:30 PM CET (Paris/Berlin), 7:00-8:30 PM Mexico City

Power BI Monthly Update - April 2024
Check out the April 2024 Power BI update to learn about new features.

| User | Count |
|---|---|
| 113 | |
| 99 | |
| 80 | |
| 69 | |
| 59 |
| User | Count |
|---|---|
| 150 | |
| 119 | |
| 104 | |
| 87 | |
| 67 |


