- Power BI forums
- Updates
- News & Announcements
- Get Help with Power BI
- Desktop
- Service
- Report Server
- Power Query
- Mobile Apps
- Developer
- DAX Commands and Tips
- Custom Visuals Development Discussion
- Health and Life Sciences
- Power BI Spanish forums
- Translated Spanish Desktop
- Power Platform Integration - Better Together!
- Power Platform Integrations (Read-only)
- Power Platform and Dynamics 365 Integrations (Read-only)
- Training and Consulting
- Instructor Led Training
- Dashboard in a Day for Women, by Women
- Galleries
- Community Connections & How-To Videos
- COVID-19 Data Stories Gallery
- Themes Gallery
- Data Stories Gallery
- R Script Showcase
- Webinars and Video Gallery
- Quick Measures Gallery
- 2021 MSBizAppsSummit Gallery
- 2020 MSBizAppsSummit Gallery
- 2019 MSBizAppsSummit Gallery
- Events
- Ideas
- Custom Visuals Ideas
- Issues
- Issues
- Events
- Upcoming Events
- Community Blog
- Power BI Community Blog
- Custom Visuals Community Blog
- Community Support
- Community Accounts & Registration
- Using the Community
- Community Feedback
Register now to learn Fabric in free live sessions led by the best Microsoft experts. From Apr 16 to May 9, in English and Spanish.
- Power BI forums
- Forums
- Get Help with Power BI
- Desktop
- How to compare individual series values with lower...
- Subscribe to RSS Feed
- Mark Topic as New
- Mark Topic as Read
- Float this Topic for Current User
- Bookmark
- Subscribe
- Printer Friendly Page
- Mark as New
- Bookmark
- Subscribe
- Mute
- Subscribe to RSS Feed
- Permalink
- Report Inappropriate Content
How to compare individual series values with lower and upper limit measures (anomaly detection)?
Hi,
I have a dataset that contains time series data - sales as a function of time by product and customer. It looks kind of like this:
| Customer | Product | Date | Sales |
| 1 | X | 2/1/21 | 24 |
| 1 | X | 2/2/21 | 56 |
| 1 | Z | 2/3/21 | 32 |
| 2 | Y | 2/2/21 | 542 |
| 2 | Y | 2/3/21 | 23 |
I'd like to flag anomalous sales point that are too large or too low for a given customer for a given product. So I created measures like this:
QUARTILE1 = PERCENTILEX.INC(SUMMARIZE(Table,'Table'[Customer],'Table'[Product]),CALCULATE(PERCENTILE.INC('Table'[Sales],0.25)),0.25)
QUARTILE3 = PERCENTILEX.INC(SUMMARIZE(Table,'Table'[Customer],'Table'[Product]),CALCULATE(PERCENTILE.INC('Table'[Sales],0.75)),0.75)
IQR = [QUARTILE3]-[QUARTILE1]
LOWER_LIMIT = [QUARTILE1]-1.5*[IQR]
UPPER_LIMIT = [QUARTILE3]+1.5*[IQR]
and now I'd like to compare each individual Sales value with the [LOWER_LIMIT] and [UPPER_LIMIT] for a given customer and a given product. I can't seem to figure it out. If I just do a calculated column that compares Table[Sales] with the limits, I always get the same value.
Could someone please help?
- Mark as New
- Bookmark
- Subscribe
- Mute
- Subscribe to RSS Feed
- Permalink
- Report Inappropriate Content
Hi @hedgy123 ,
You cannot create a calculated column based on a measure. Measures are based on context so the result is variable depending on the values you have on the context, meaning visualizations, filters, and so on.
You need to make this based on the values you present you need to apply ALL or ALLSELECTED on the quartile value that will get the same value for every single row then use that has your difference to each of the row value.
Can you share based on the values you present what are the values for the quartiles that you need to achieve?
Regards
Miguel Félix
Did I answer your question? Mark my post as a solution!
Proud to be a Super User!
Check out my blog: Power BI em Português- Mark as New
- Bookmark
- Subscribe
- Mute
- Subscribe to RSS Feed
- Permalink
- Report Inappropriate Content
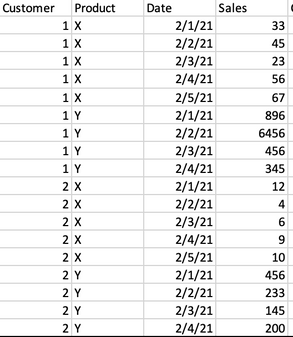
Thanks Miguel. Yes, here's what I'd like to achieve with some sample data:
Here's my starting data table:

Here's a calculation of the quartiles and upper and lower limits per customer per product
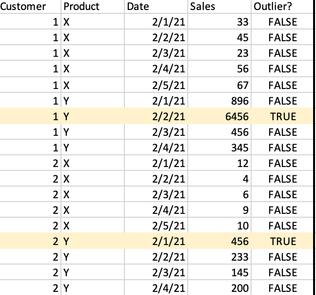
and here's my desired output: I compare every Sales value with the upper and lower limits for the relevant customer and product, and flag those values that are either lower than the lower limit or larger than the upper limit as outliers:
It's this last step I am struggling with. I am a PowerBI beginner, so not sure what you mean by applying ALL or ALLSELECTED on the quartile value?
Thanks very much for your help.
Helpful resources

Microsoft Fabric Learn Together
Covering the world! 9:00-10:30 AM Sydney, 4:00-5:30 PM CET (Paris/Berlin), 7:00-8:30 PM Mexico City

Power BI Monthly Update - April 2024
Check out the April 2024 Power BI update to learn about new features.

| User | Count |
|---|---|
| 113 | |
| 100 | |
| 78 | |
| 76 | |
| 52 |
| User | Count |
|---|---|
| 144 | |
| 109 | |
| 108 | |
| 88 | |
| 61 |


