- Power BI forums
- Updates
- News & Announcements
- Get Help with Power BI
- Desktop
- Service
- Report Server
- Power Query
- Mobile Apps
- Developer
- DAX Commands and Tips
- Custom Visuals Development Discussion
- Health and Life Sciences
- Power BI Spanish forums
- Translated Spanish Desktop
- Power Platform Integration - Better Together!
- Power Platform Integrations (Read-only)
- Power Platform and Dynamics 365 Integrations (Read-only)
- Training and Consulting
- Instructor Led Training
- Dashboard in a Day for Women, by Women
- Galleries
- Community Connections & How-To Videos
- COVID-19 Data Stories Gallery
- Themes Gallery
- Data Stories Gallery
- R Script Showcase
- Webinars and Video Gallery
- Quick Measures Gallery
- 2021 MSBizAppsSummit Gallery
- 2020 MSBizAppsSummit Gallery
- 2019 MSBizAppsSummit Gallery
- Events
- Ideas
- Custom Visuals Ideas
- Issues
- Issues
- Events
- Upcoming Events
- Community Blog
- Power BI Community Blog
- Custom Visuals Community Blog
- Community Support
- Community Accounts & Registration
- Using the Community
- Community Feedback
Register now to learn Fabric in free live sessions led by the best Microsoft experts. From Apr 16 to May 9, in English and Spanish.
- Power BI forums
- Forums
- Get Help with Power BI
- Desktop
- How to combine responses in multiple table fields ...
- Subscribe to RSS Feed
- Mark Topic as New
- Mark Topic as Read
- Float this Topic for Current User
- Bookmark
- Subscribe
- Printer Friendly Page
- Mark as New
- Bookmark
- Subscribe
- Mute
- Subscribe to RSS Feed
- Permalink
- Report Inappropriate Content
How to combine responses in multiple table fields into one field
Hi All,
I have tried my best to do read posts watch Power BI training videos in how to my requirements but no luck so far, but I am pretty new with Power BI and a bit is going over my head.
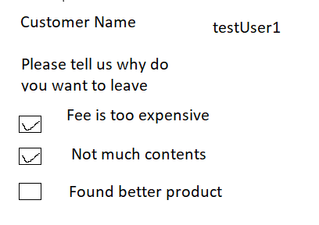
So I have a Customer Feedback form which capture multiple values of responses. So currently users will need to choose 2 of the following options.
Using Direct Import to PowerBI Desktop using sql query to return the following result.
So I would like to achieve the following with a idea of new column created in PowerBI called Feedbacks which combine all responses of each users in one field. I just want to find out if it is possible to achieve something like this in Power BI.
Any help would be greatly appreciated. Thank you
Solved! Go to Solution.
- Mark as New
- Bookmark
- Subscribe
- Mute
- Subscribe to RSS Feed
- Permalink
- Report Inappropriate Content
Hi @aneuk22
Try This
UserFeedback =

var _FE = Max('Table'[FeeExpensive])
var _FB = MAX('Table'[FoundBetterProduct])
var _NM = MAX('Table'[NotMuchContent])

var _Switch = Switch (TRUE(), AND(And(_FE = 1, _FB = 1),_NM=0), "FeeExpensive, FoundBetterProduct",
                       AND(AND( _FB = 1 , _NM = 1),_FE=0), "FoundBetterProduct, NotMuchContent",
                       AND(AND( _FE = 1 , _NM  =1),_FB=0),"FeeExpensive,NotMuchContent",
                        "FeeExpensive,NotMuchContent,FoundBetterProduct")

Return _Switch
Let me know if you have any questions.
If this solves your issues, please mark it as the solution, so that others can find it easily. Kudos 👍are nice too.
Nathaniel
Did I answer your question? Mark my post as a solution!
Proud to be a Super User!
- Mark as New
- Bookmark
- Subscribe
- Mute
- Subscribe to RSS Feed
- Permalink
- Report Inappropriate Content
Hi @aneuk22 ,
Glad this worked for you!
Nathaniel
Did I answer your question? Mark my post as a solution!
Proud to be a Super User!
- Mark as New
- Bookmark
- Subscribe
- Mute
- Subscribe to RSS Feed
- Permalink
- Report Inappropriate Content
Hi @aneuk22
Try This
UserFeedback =

var _FE = Max('Table'[FeeExpensive])
var _FB = MAX('Table'[FoundBetterProduct])
var _NM = MAX('Table'[NotMuchContent])

var _Switch = Switch (TRUE(), AND(And(_FE = 1, _FB = 1),_NM=0), "FeeExpensive, FoundBetterProduct",
                       AND(AND( _FB = 1 , _NM = 1),_FE=0), "FoundBetterProduct, NotMuchContent",
                       AND(AND( _FE = 1 , _NM  =1),_FB=0),"FeeExpensive,NotMuchContent",
                        "FeeExpensive,NotMuchContent,FoundBetterProduct")

Return _Switch
Let me know if you have any questions.
If this solves your issues, please mark it as the solution, so that others can find it easily. Kudos 👍are nice too.
Nathaniel
Did I answer your question? Mark my post as a solution!
Proud to be a Super User!
- Mark as New
- Bookmark
- Subscribe
- Mute
- Subscribe to RSS Feed
- Permalink
- Report Inappropriate Content
Hi,
Do you want to achieve this result in the visual or in the raw table itself? Please also share the raw data in a format that can be pasted in an MS Excel file.
Regards,
Ashish Mathur
http://www.ashishmathur.com
https://www.linkedin.com/in/excelenthusiasts/
Helpful resources

Microsoft Fabric Learn Together
Covering the world! 9:00-10:30 AM Sydney, 4:00-5:30 PM CET (Paris/Berlin), 7:00-8:30 PM Mexico City

Power BI Monthly Update - April 2024
Check out the April 2024 Power BI update to learn about new features.

| User | Count |
|---|---|
| 107 | |
| 99 | |
| 78 | |
| 64 | |
| 58 |
| User | Count |
|---|---|
| 148 | |
| 111 | |
| 94 | |
| 84 | |
| 67 |


