- Power BI forums
- Updates
- News & Announcements
- Get Help with Power BI
- Desktop
- Service
- Report Server
- Power Query
- Mobile Apps
- Developer
- DAX Commands and Tips
- Custom Visuals Development Discussion
- Health and Life Sciences
- Power BI Spanish forums
- Translated Spanish Desktop
- Power Platform Integration - Better Together!
- Power Platform Integrations (Read-only)
- Power Platform and Dynamics 365 Integrations (Read-only)
- Training and Consulting
- Instructor Led Training
- Dashboard in a Day for Women, by Women
- Galleries
- Community Connections & How-To Videos
- COVID-19 Data Stories Gallery
- Themes Gallery
- Data Stories Gallery
- R Script Showcase
- Webinars and Video Gallery
- Quick Measures Gallery
- 2021 MSBizAppsSummit Gallery
- 2020 MSBizAppsSummit Gallery
- 2019 MSBizAppsSummit Gallery
- Events
- Ideas
- Custom Visuals Ideas
- Issues
- Issues
- Events
- Upcoming Events
- Community Blog
- Power BI Community Blog
- Custom Visuals Community Blog
- Community Support
- Community Accounts & Registration
- Using the Community
- Community Feedback
Register now to learn Fabric in free live sessions led by the best Microsoft experts. From Apr 16 to May 9, in English and Spanish.
- Power BI forums
- Forums
- Get Help with Power BI
- Desktop
- Re: How to calculate using Total from columns
- Subscribe to RSS Feed
- Mark Topic as New
- Mark Topic as Read
- Float this Topic for Current User
- Bookmark
- Subscribe
- Printer Friendly Page
- Mark as New
- Bookmark
- Subscribe
- Mute
- Subscribe to RSS Feed
- Permalink
- Report Inappropriate Content
How to calculate using Total from columns
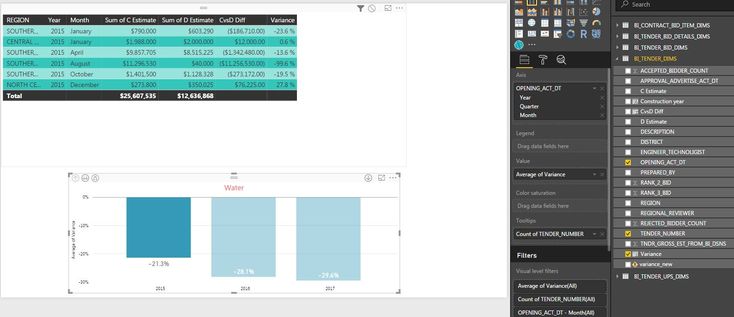
I have a very simple problem, but I am not good with DAX or even measures yet, so this may be preventing me from getting the answer.
I have a dataset with the following information.
Region | C Estimate | D Estimate/Low Bid | (D-C) Difference | Variance from Estimate = (D-C)/C |
South | 790 | 603 | -187 | -23.7% |
Central | 1,988 | 2,000 | 12 | 0.6% |
South | 9,857 | 8,515 | -1342 | -13.6% |
South | 11,296 | 40 | -11256 | -99.6% |
South | 1,401 | 1,128 | -273 | -19.5% |
North | 273 | 350 | 77 | 28.2% |
Total | 25,605 | 350 |
| -50.7% |
I want it to calculate the variance between Estimate and Bid for various categories, but I need the Variance of the total.
Question: How do I get -50.7% in the graph, which is coming from “Total” Row.
What I am getting is the average of the variance -21.3%, this is the average of the individual numbers
Average= (-23.7% +0.6% + -13.6% + -99.6% +-19.5% +28.2%)/6 =-21.3%
Right now I am calculating Variance (column 5) using the following measure:
Variance = DIVIDE(BI_TENDER_DIMS[CvsD Diff],BI_TENDER_DIMS[C Estimate])
Please note numbers in the image below are same as numbers above, but divided by 1000 approx.
Variance calculation only gives me a few options, and none of those include calculation on the total SUm value. These rows od data will change based on several filters, but I always need the variance from the total value, and I cannot calculate that yet.

Solved! Go to Solution.
- Mark as New
- Bookmark
- Subscribe
- Mute
- Subscribe to RSS Feed
- Permalink
- Report Inappropriate Content
Hi @ngupta,
According to your description above, you should be able to use the formula below to create a measure(instead of a calculate column) to calculate the Variance in this scenario. ![]()
Variance = DIVIDE(SUM(BI_TENDER_DIMS[CvsD Diff]),SUM(BI_TENDER_DIMS[C Estimate]))
Regards
- Mark as New
- Bookmark
- Subscribe
- Mute
- Subscribe to RSS Feed
- Permalink
- Report Inappropriate Content
Hi, I am having a very similar issue but it seems like I am doing what you suggest and still getting an incorrect subtotal on my matrix. I am also very new to Bi, so I apologize if a super easy question, which I hope it is! I also may have done this completely wrong! Thanks for your help
I am trying to show the month over month variance for revenue, which I have but the subtotal is giving me the last calculated number, instead of the total variance, which I want to be the total of all variances. In the example below the total should be $3,409,237.76. also similar, is the additional formula to find the % variance.
I used the following measures to get to this:
MTD Rev = TOTALMTD(sum(Revenue[Total Revenue]),'Calendar'[Date])
LY MTD Rev = calculate([MTD Rev],SAMEPERIODLASTYEAR('Calendar'[Date]))
MTD Rev Var = [MTD Rev]-[LY MTD Rev]
MTD Rev Var % = Divide([MTD Rev Var],[LY MTD Rev])
- Mark as New
- Bookmark
- Subscribe
- Mute
- Subscribe to RSS Feed
- Permalink
- Report Inappropriate Content
Yes, this works. Thankyou ![]()
I did try it earlier, but I was getting an error, probably because the syntax was wrong.
Helpful resources

Microsoft Fabric Learn Together
Covering the world! 9:00-10:30 AM Sydney, 4:00-5:30 PM CET (Paris/Berlin), 7:00-8:30 PM Mexico City

Power BI Monthly Update - April 2024
Check out the April 2024 Power BI update to learn about new features.

| User | Count |
|---|---|
| 106 | |
| 93 | |
| 75 | |
| 62 | |
| 50 |
| User | Count |
|---|---|
| 147 | |
| 107 | |
| 105 | |
| 87 | |
| 61 |


