- Power BI forums
- Updates
- News & Announcements
- Get Help with Power BI
- Desktop
- Service
- Report Server
- Power Query
- Mobile Apps
- Developer
- DAX Commands and Tips
- Custom Visuals Development Discussion
- Health and Life Sciences
- Power BI Spanish forums
- Translated Spanish Desktop
- Power Platform Integration - Better Together!
- Power Platform Integrations (Read-only)
- Power Platform and Dynamics 365 Integrations (Read-only)
- Training and Consulting
- Instructor Led Training
- Dashboard in a Day for Women, by Women
- Galleries
- Community Connections & How-To Videos
- COVID-19 Data Stories Gallery
- Themes Gallery
- Data Stories Gallery
- R Script Showcase
- Webinars and Video Gallery
- Quick Measures Gallery
- 2021 MSBizAppsSummit Gallery
- 2020 MSBizAppsSummit Gallery
- 2019 MSBizAppsSummit Gallery
- Events
- Ideas
- Custom Visuals Ideas
- Issues
- Issues
- Events
- Upcoming Events
- Community Blog
- Power BI Community Blog
- Custom Visuals Community Blog
- Community Support
- Community Accounts & Registration
- Using the Community
- Community Feedback
Register now to learn Fabric in free live sessions led by the best Microsoft experts. From Apr 16 to May 9, in English and Spanish.
- Power BI forums
- Forums
- Get Help with Power BI
- Desktop
- How to calculate average cumulative?
- Subscribe to RSS Feed
- Mark Topic as New
- Mark Topic as Read
- Float this Topic for Current User
- Bookmark
- Subscribe
- Printer Friendly Page
- Mark as New
- Bookmark
- Subscribe
- Mute
- Subscribe to RSS Feed
- Permalink
- Report Inappropriate Content
How to calculate average cumulative?
Hi
I am having below table
Here the average column is a measure. Below caulcuation I did

I want to calculate the average cumulative value . Need output as below. I did this calculation in Excel and sample excel file attached here https://we.tl/t-N2e7mLeMaF
Cumulative Average is 1045.428571 for 30th Sep is average of all the values. For 29 sep, cumulative average is 1046.83333 is average of values from 29 sep to 30 sep. Same is applicable for other dates.
PBIX file attached here https://we.tl/t-0g7kEMYd7O
Solved! Go to Solution.
- Mark as New
- Bookmark
- Subscribe
- Mute
- Subscribe to RSS Feed
- Permalink
- Report Inappropriate Content
@bourne2000 please create a Calculated Column and call it "Average".
Average = ( SUM ( 'Table'[Min Price (Avg)] ) + SUM ( 'Table'[Max Price (Avg)] ) / 2
From here, please use the following measure:
Measure = TOTALYTD ( SUM ( Table[Average] ) , 'Table1'[Date] )
Once you have the above done, drag the measure into your Table visual and it should work.
Let me know how it all goes 🙂
If I have posted a response that resolves your question, please accept it as a solution to formally close the post.
Also, if you are as passionate about Power BI, DAX and data as I am, please feel free to reach out if you have any questions, queries, or if you simply want to connect and talk to another data geek!
Want to connect?www.linkedin.com/in/theoconias
- Mark as New
- Bookmark
- Subscribe
- Mute
- Subscribe to RSS Feed
- Permalink
- Report Inappropriate Content
Hi @bourne2000
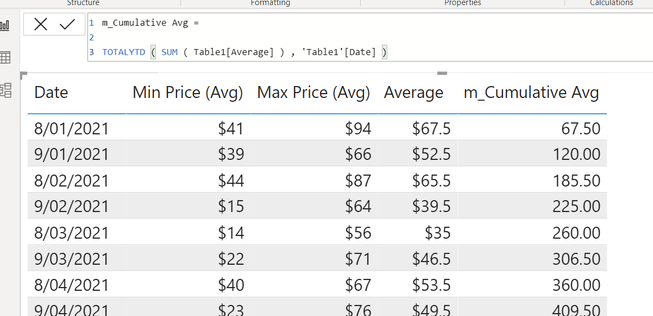
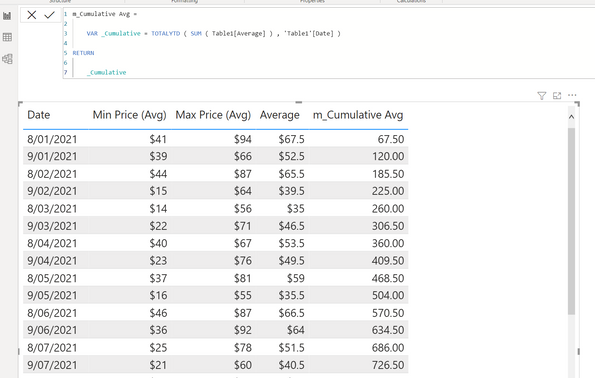
Create a measure as follows:
Measure = TOTALYTD ( SUM ( Table1[Average] ) , 'Table1'[Date] )The output will be the cumulative average as below.
I've used variables in my example in the event you want to expand on the measure, etc. However, no need to change the Measure presented above if there's no reason to expand.
Hope this helps 🙂
If I have posted a response that resolves your question, please accept it as a solution to formally close the post.
Also, if you are as passionate about Power BI, DAX and data as I am, please feel free to reach out if you have any questions, queries, or if you simply want to connect and talk to another data geek!
Want to connect?www.linkedin.com/in/theoconias
- Mark as New
- Bookmark
- Subscribe
- Mute
- Subscribe to RSS Feed
- Permalink
- Report Inappropriate Content
@TheoC Thanks
I am not able to get the average in the dax measure. My average column is a measure.
It's not coming. Can you guide me?
- Mark as New
- Bookmark
- Subscribe
- Mute
- Subscribe to RSS Feed
- Permalink
- Report Inappropriate Content
@bourne2000 do you have a column called "Average"? If so, you should be able to copy and paste the following:
Measure = TOTALYTD ( SUM ( 'Append1'[Average] ) , 'Append1'[Date] )
If I have posted a response that resolves your question, please accept it as a solution to formally close the post.
Also, if you are as passionate about Power BI, DAX and data as I am, please feel free to reach out if you have any questions, queries, or if you simply want to connect and talk to another data geek!
Want to connect?www.linkedin.com/in/theoconias
- Mark as New
- Bookmark
- Subscribe
- Mute
- Subscribe to RSS Feed
- Permalink
- Report Inappropriate Content
@TheoC No there is no column called "Average" . Average is a measure. That's problem I face. How to overcome ?
- Mark as New
- Bookmark
- Subscribe
- Mute
- Subscribe to RSS Feed
- Permalink
- Report Inappropriate Content
@bourne2000 try this: Measure = TOTALYTD ( [Average] , 'Append1'[Date] )
If I have posted a response that resolves your question, please accept it as a solution to formally close the post.
Also, if you are as passionate about Power BI, DAX and data as I am, please feel free to reach out if you have any questions, queries, or if you simply want to connect and talk to another data geek!
Want to connect?www.linkedin.com/in/theoconias
- Mark as New
- Bookmark
- Subscribe
- Mute
- Subscribe to RSS Feed
- Permalink
- Report Inappropriate Content
@TheoC THANKS. I tried and getting this output. It's not taking average. Values are not correct I think
- Mark as New
- Bookmark
- Subscribe
- Mute
- Subscribe to RSS Feed
- Permalink
- Report Inappropriate Content
- Mark as New
- Bookmark
- Subscribe
- Mute
- Subscribe to RSS Feed
- Permalink
- Report Inappropriate Content
@bourne2000 please create a Calculated Column and call it "Average".
Average = ( SUM ( 'Table'[Min Price (Avg)] ) + SUM ( 'Table'[Max Price (Avg)] ) / 2
From here, please use the following measure:
Measure = TOTALYTD ( SUM ( Table[Average] ) , 'Table1'[Date] )
Once you have the above done, drag the measure into your Table visual and it should work.
Let me know how it all goes 🙂
If I have posted a response that resolves your question, please accept it as a solution to formally close the post.
Also, if you are as passionate about Power BI, DAX and data as I am, please feel free to reach out if you have any questions, queries, or if you simply want to connect and talk to another data geek!
Want to connect?www.linkedin.com/in/theoconias
Helpful resources

Microsoft Fabric Learn Together
Covering the world! 9:00-10:30 AM Sydney, 4:00-5:30 PM CET (Paris/Berlin), 7:00-8:30 PM Mexico City

Power BI Monthly Update - April 2024
Check out the April 2024 Power BI update to learn about new features.

| User | Count |
|---|---|
| 114 | |
| 99 | |
| 83 | |
| 70 | |
| 61 |
| User | Count |
|---|---|
| 149 | |
| 114 | |
| 107 | |
| 89 | |
| 67 |


