- Power BI forums
- Updates
- News & Announcements
- Get Help with Power BI
- Desktop
- Service
- Report Server
- Power Query
- Mobile Apps
- Developer
- DAX Commands and Tips
- Custom Visuals Development Discussion
- Health and Life Sciences
- Power BI Spanish forums
- Translated Spanish Desktop
- Power Platform Integration - Better Together!
- Power Platform Integrations (Read-only)
- Power Platform and Dynamics 365 Integrations (Read-only)
- Training and Consulting
- Instructor Led Training
- Dashboard in a Day for Women, by Women
- Galleries
- Community Connections & How-To Videos
- COVID-19 Data Stories Gallery
- Themes Gallery
- Data Stories Gallery
- R Script Showcase
- Webinars and Video Gallery
- Quick Measures Gallery
- 2021 MSBizAppsSummit Gallery
- 2020 MSBizAppsSummit Gallery
- 2019 MSBizAppsSummit Gallery
- Events
- Ideas
- Custom Visuals Ideas
- Issues
- Issues
- Events
- Upcoming Events
- Community Blog
- Power BI Community Blog
- Custom Visuals Community Blog
- Community Support
- Community Accounts & Registration
- Using the Community
- Community Feedback
Register now to learn Fabric in free live sessions led by the best Microsoft experts. From Apr 16 to May 9, in English and Spanish.
- Power BI forums
- Forums
- Get Help with Power BI
- Desktop
- Help with relationships
- Subscribe to RSS Feed
- Mark Topic as New
- Mark Topic as Read
- Float this Topic for Current User
- Bookmark
- Subscribe
- Printer Friendly Page
- Mark as New
- Bookmark
- Subscribe
- Mute
- Subscribe to RSS Feed
- Permalink
- Report Inappropriate Content
Help with relationships
Link to data and Power BI file discussed here:
Hi everyone
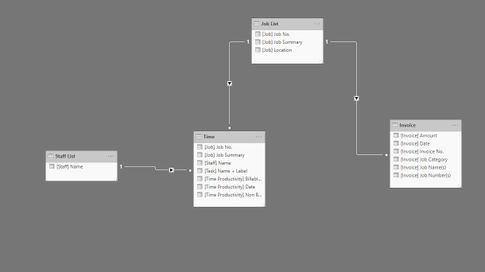
I have been learning Power BI for a month or so and I am struggling with relationships. Images below.
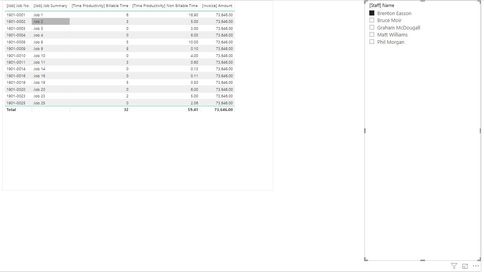
I am reporting out of Workflow Max and it uses different tables for Time and Invoicing and I am trying to link the two together. In the example file I have a table that refers to both the Time and Invoice tables and a slicer for staff name. I want to be able to slice the data per person, but to also have the invoice amount totalling correctly when referring to the Time entries. (once working I will work on visuals)
I have avoided using Many to Many after watching may training videos suggesting not doing this. I linked in a job list and a staff list and it is getting half way there, but I just have not figured out relationships properly yet. Can anyone help me getting the Time and Invoice tables talking to each other correcly? My actual data set is several thousand entries in both tables since 2013. Not all jobs are invoiced each month (obviously)
Solved! Go to Solution.
- Mark as New
- Bookmark
- Subscribe
- Mute
- Subscribe to RSS Feed
- Permalink
- Report Inappropriate Content
By the way, you may help accept solution. Your contribution is highly appreciated.
If this post helps, then please consider Accept it as the solution to help the other members find it more quickly.
- Mark as New
- Bookmark
- Subscribe
- Mute
- Subscribe to RSS Feed
- Permalink
- Report Inappropriate Content
Hey,
I guess you are looking for a measure like this:
Measure =
CALCULATE(
    SUM('Invoice'[[Invoice]] Amount])
    , CROSSFILTER('Job List'[[Job]] Job No.] , 'Time'[[Job]] Job No.] , Both)
)
Using CROSSFILTER allows to avoid many-to-many relationships, but still provides the possibility to use the filter direction "Both".
This allows to create something like this:
But, I'm not sure how you want to treat the fact, that Brenton and Chris have worked on job number "1901-0001" and for this reason the measure shows the same value. But this is not an issue of the measure, but this is due to data distribution. Of course this can be used to calculate some kind of "share".
Hopefully this is what you are looking.
Regards,
Tom
Did I answer your question? Mark my post as a solution, this will help others!
Proud to be a Super User!
I accept Kudos 😉
Hamburg, Germany
- Mark as New
- Bookmark
- Subscribe
- Mute
- Subscribe to RSS Feed
- Permalink
- Report Inappropriate Content
I am struggling to apply this to my model. I want the column "invoiced Amount total" from table "Invoiced Time Report" to propogate in the lower visual combined with the table "Workflow Time Report". Getting this same result everywhich way I try to do this. ?????
My cross filter measure is
Inv Time measure 2 = CALCULATE(SUM('Invoiced Time Report'[[Task]] Amount]) , CROSSFILTER('Job List'[Job No.] ,'Workflow Time Report'[[Job]] Job No.], Both) )
- Mark as New
- Bookmark
- Subscribe
- Mute
- Subscribe to RSS Feed
- Permalink
- Report Inappropriate Content
Hi. Might be useful. However. This is my companies invoice against time. We have 50 staff, and typically 3 or 4 people will owkr on any one job. My director asked me to be able to pick out monthly totals for each staff member if I can. So I the duplication of the total will not quite get me what I need.
I will certainly study the measure suggested and may use it in some cases.
I have wtached videos where they talk about this totals not carrying across tables, but they fix it with relationships. I can never make it work 😞
- Mark as New
- Bookmark
- Subscribe
- Mute
- Subscribe to RSS Feed
- Permalink
- Report Inappropriate Content
Hey,
as there is no clue in the data how the amount from the invoice table is related to a staff member the "correct" number (from a technical point of view) is provided by the measure, this can not be solved by data modeling, just by additional information or by some kind of business rule like this
per staff member and job no calculate
Measure * DIVIDE(individual hours, sum of hours by all staff members)
Regards,
Tom
Did I answer your question? Mark my post as a solution, this will help others!
Proud to be a Super User!
I accept Kudos 😉
Hamburg, Germany
- Mark as New
- Bookmark
- Subscribe
- Mute
- Subscribe to RSS Feed
- Permalink
- Report Inappropriate Content
Food for thought. Many thanks
- Mark as New
- Bookmark
- Subscribe
- Mute
- Subscribe to RSS Feed
- Permalink
- Report Inappropriate Content
By the way, you may help accept solution. Your contribution is highly appreciated.
If this post helps, then please consider Accept it as the solution to help the other members find it more quickly.
Helpful resources

Microsoft Fabric Learn Together
Covering the world! 9:00-10:30 AM Sydney, 4:00-5:30 PM CET (Paris/Berlin), 7:00-8:30 PM Mexico City

Power BI Monthly Update - April 2024
Check out the April 2024 Power BI update to learn about new features.

| User | Count |
|---|---|
| 114 | |
| 100 | |
| 78 | |
| 75 | |
| 49 |
| User | Count |
|---|---|
| 145 | |
| 108 | |
| 107 | |
| 89 | |
| 61 |


