- Power BI forums
- Updates
- News & Announcements
- Get Help with Power BI
- Desktop
- Service
- Report Server
- Power Query
- Mobile Apps
- Developer
- DAX Commands and Tips
- Custom Visuals Development Discussion
- Health and Life Sciences
- Power BI Spanish forums
- Translated Spanish Desktop
- Power Platform Integration - Better Together!
- Power Platform Integrations (Read-only)
- Power Platform and Dynamics 365 Integrations (Read-only)
- Training and Consulting
- Instructor Led Training
- Dashboard in a Day for Women, by Women
- Galleries
- Community Connections & How-To Videos
- COVID-19 Data Stories Gallery
- Themes Gallery
- Data Stories Gallery
- R Script Showcase
- Webinars and Video Gallery
- Quick Measures Gallery
- 2021 MSBizAppsSummit Gallery
- 2020 MSBizAppsSummit Gallery
- 2019 MSBizAppsSummit Gallery
- Events
- Ideas
- Custom Visuals Ideas
- Issues
- Issues
- Events
- Upcoming Events
- Community Blog
- Power BI Community Blog
- Custom Visuals Community Blog
- Community Support
- Community Accounts & Registration
- Using the Community
- Community Feedback
Register now to learn Fabric in free live sessions led by the best Microsoft experts. From Apr 16 to May 9, in English and Spanish.
- Power BI forums
- Forums
- Get Help with Power BI
- Desktop
- Re: Help with calculate measure with 4 filters
- Subscribe to RSS Feed
- Mark Topic as New
- Mark Topic as Read
- Float this Topic for Current User
- Bookmark
- Subscribe
- Printer Friendly Page
- Mark as New
- Bookmark
- Subscribe
- Mute
- Subscribe to RSS Feed
- Permalink
- Report Inappropriate Content
Help with calculate measure with 4 filters
Hello.
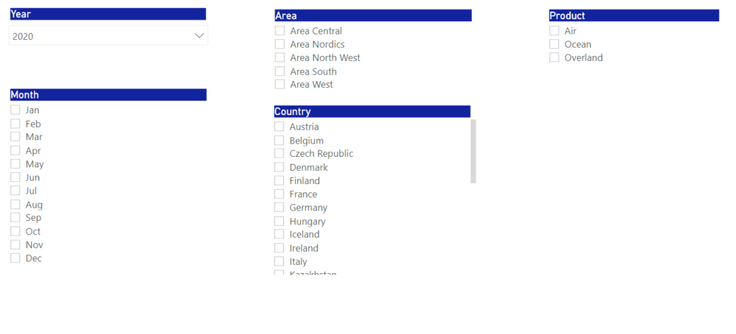
I need help with a calculations based on 4 slicers filtering the table.
I was wondering if it's possible to have like a lookup to bring me the correct value.
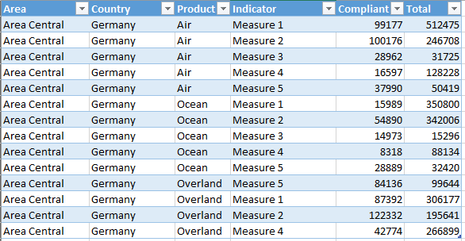
Bellow you can find my slicers and my table.
TBL_Automation (this is my raw data it has a structure of Indicator || Month || Year || Complaint || Total ||)
TBL_Automation_Indicator (this is the table only to show the values per month, YTD, Trends etc, based on the filters)
Slicers tables:
COD_Calendar (has the year and Month), COD_Region (has Area and Country) and COD_Product
What i intend to have is for example to calculate the measure for this indicators is basic Complaint/Total, however what i can not do is to only show the calculation based on a selection Year || Month|| Area || Country || Product.
if we have 2020 || Jan || Area Central || Germany || Air
The value should filter the raw data table and get me the value for complaint and total.
Solved! Go to Solution.
- Mark as New
- Bookmark
- Subscribe
- Mute
- Subscribe to RSS Feed
- Permalink
- Report Inappropriate Content
@Anonymous
Ok, cool. So this sounds like a modelling question then.
In that case, all you need to do in the model screen is to drag COD_Region[Country] to TBL_X[Country], and COD_Product[Product] to TBL_X[Product]. If your COD_X tables are set up correctly, this should create One-to-Many relationships from COD_X to TBL_X.
Your COD_Calendar table needs a little extra work. You will need to merge the fields in this table, as well as the [Month] and [Year] fields in each of your TBL_X tables into new fields, called [monthYear] or similar. You would then drag COD_Calendar[monthYear] to each TBL_X[monthYear] to, again, create One-to-Many relationships.
Once the model is built, you would make sure to always use the fields from your COD_X tables in visuals and slicers. This will then filter all of your TBL_X data correctly.
Pete
Now accepting Kudos! If my post helped you, why not give it a thumbs-up?
Proud to be a Datanaut!
- Mark as New
- Bookmark
- Subscribe
- Mute
- Subscribe to RSS Feed
- Permalink
- Report Inappropriate Content
@Anonymous ,
You will need to create a measure that calculates your metric over all of your TBL_X tables, if that's what you want it to do.
I guess something like this would work:
complaint% =
VAR complaints =
SUM(TBL_X1[Complaint]) + SUM(TBL_X2[Complaint]) + SUM(TBL_X3[Complaint])
VAR total =
SUM(TBL_X1[Total]) + SUM(TBL_X2[Total]) + SUM(TBL_X3[Total])
RETURN
complaints / total
If all of your TBL_X tables contain the same fields and data, it might be worth looking into appending them together in Power Query. This would then avoid jumping through hoops like this when you are creating measures.
Pete
Now accepting Kudos! If my post helped you, why not give it a thumbs-up?
Proud to be a Datanaut!
- Mark as New
- Bookmark
- Subscribe
- Mute
- Subscribe to RSS Feed
- Permalink
- Report Inappropriate Content
Hi @Anonymous ,
There's a couple of things to unpack here but the first question is:
How you are expecting to be able to filter on [Area], [Country], and [Product] when it doesn't look like your fact table (TBL_Automation) has any fields in it that pertain to these dimensions?
Your fact table HAS to have these dimensions in for the data to be filtered/aggregated by them.
Pete
Now accepting Kudos! If my post helped you, why not give it a thumbs-up?
Proud to be a Datanaut!
- Mark as New
- Bookmark
- Subscribe
- Mute
- Subscribe to RSS Feed
- Permalink
- Report Inappropriate Content
Hi @BA_Pete
Sorry the i didn't pass those fields for the image i sent.
TBl_Automation has those fields
Thank you in advance.
- Mark as New
- Bookmark
- Subscribe
- Mute
- Subscribe to RSS Feed
- Permalink
- Report Inappropriate Content
@Anonymous ,
Ah, ok. The devil is in the detail.
Is TBL_Automation the only fact table you are going to use in your data model? If so, then there's no reason for you to use any of your COD_ tables. Just use the fields from TBL_Automation in visuals/slicers and Power BI will do all the grouping and aggregation for you.
Or am I missing something here?
Pete
Now accepting Kudos! If my post helped you, why not give it a thumbs-up?
Proud to be a Datanaut!
- Mark as New
- Bookmark
- Subscribe
- Mute
- Subscribe to RSS Feed
- Permalink
- Report Inappropriate Content
@BA_Pete ,
In fact i will have 3 other tables with the same format as TBL_Automation, that would also have TBL Indicators table.
These is the reason for the COD_ tables.
- Mark as New
- Bookmark
- Subscribe
- Mute
- Subscribe to RSS Feed
- Permalink
- Report Inappropriate Content
@Anonymous
Ok, cool. So this sounds like a modelling question then.
In that case, all you need to do in the model screen is to drag COD_Region[Country] to TBL_X[Country], and COD_Product[Product] to TBL_X[Product]. If your COD_X tables are set up correctly, this should create One-to-Many relationships from COD_X to TBL_X.
Your COD_Calendar table needs a little extra work. You will need to merge the fields in this table, as well as the [Month] and [Year] fields in each of your TBL_X tables into new fields, called [monthYear] or similar. You would then drag COD_Calendar[monthYear] to each TBL_X[monthYear] to, again, create One-to-Many relationships.
Once the model is built, you would make sure to always use the fields from your COD_X tables in visuals and slicers. This will then filter all of your TBL_X data correctly.
Pete
Now accepting Kudos! If my post helped you, why not give it a thumbs-up?
Proud to be a Datanaut!
- Mark as New
- Bookmark
- Subscribe
- Mute
- Subscribe to RSS Feed
- Permalink
- Report Inappropriate Content
My issue here is that does the measure %Measure 1 = Complaint/Total, will work just applying the filters?
will the calculations be made correctly or should i use a lookup?
- Mark as New
- Bookmark
- Subscribe
- Mute
- Subscribe to RSS Feed
- Permalink
- Report Inappropriate Content
@Anonymous ,
You will need to create a measure that calculates your metric over all of your TBL_X tables, if that's what you want it to do.
I guess something like this would work:
complaint% =
VAR complaints =
SUM(TBL_X1[Complaint]) + SUM(TBL_X2[Complaint]) + SUM(TBL_X3[Complaint])
VAR total =
SUM(TBL_X1[Total]) + SUM(TBL_X2[Total]) + SUM(TBL_X3[Total])
RETURN
complaints / total
If all of your TBL_X tables contain the same fields and data, it might be worth looking into appending them together in Power Query. This would then avoid jumping through hoops like this when you are creating measures.
Pete
Now accepting Kudos! If my post helped you, why not give it a thumbs-up?
Proud to be a Datanaut!
Helpful resources

Microsoft Fabric Learn Together
Covering the world! 9:00-10:30 AM Sydney, 4:00-5:30 PM CET (Paris/Berlin), 7:00-8:30 PM Mexico City

Power BI Monthly Update - April 2024
Check out the April 2024 Power BI update to learn about new features.

| User | Count |
|---|---|
| 113 | |
| 97 | |
| 84 | |
| 67 | |
| 60 |
| User | Count |
|---|---|
| 150 | |
| 120 | |
| 99 | |
| 87 | |
| 68 |


