- Power BI forums
- Updates
- News & Announcements
- Get Help with Power BI
- Desktop
- Service
- Report Server
- Power Query
- Mobile Apps
- Developer
- DAX Commands and Tips
- Custom Visuals Development Discussion
- Health and Life Sciences
- Power BI Spanish forums
- Translated Spanish Desktop
- Power Platform Integration - Better Together!
- Power Platform Integrations (Read-only)
- Power Platform and Dynamics 365 Integrations (Read-only)
- Training and Consulting
- Instructor Led Training
- Dashboard in a Day for Women, by Women
- Galleries
- Community Connections & How-To Videos
- COVID-19 Data Stories Gallery
- Themes Gallery
- Data Stories Gallery
- R Script Showcase
- Webinars and Video Gallery
- Quick Measures Gallery
- 2021 MSBizAppsSummit Gallery
- 2020 MSBizAppsSummit Gallery
- 2019 MSBizAppsSummit Gallery
- Events
- Ideas
- Custom Visuals Ideas
- Issues
- Issues
- Events
- Upcoming Events
- Community Blog
- Power BI Community Blog
- Custom Visuals Community Blog
- Community Support
- Community Accounts & Registration
- Using the Community
- Community Feedback
Register now to learn Fabric in free live sessions led by the best Microsoft experts. From Apr 16 to May 9, in English and Spanish.
- Power BI forums
- Forums
- Get Help with Power BI
- Desktop
- Re: Help needed on coming up with TOP 5, 10 and 25...
- Subscribe to RSS Feed
- Mark Topic as New
- Mark Topic as Read
- Float this Topic for Current User
- Bookmark
- Subscribe
- Printer Friendly Page
- Mark as New
- Bookmark
- Subscribe
- Mute
- Subscribe to RSS Feed
- Permalink
- Report Inappropriate Content
Help needed on coming up with TOP 5, 10 and 25 within one Visualization
Hello,
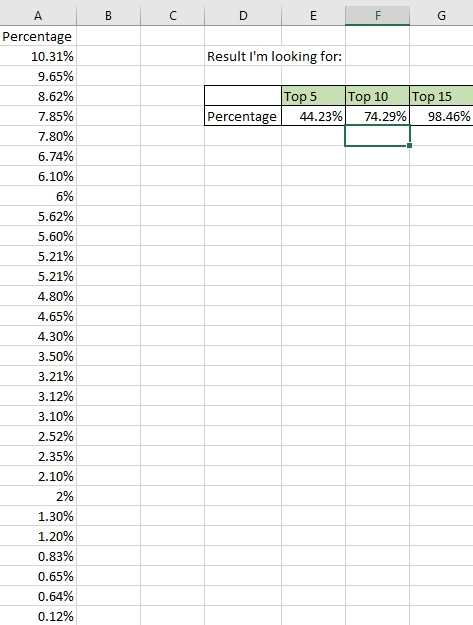
I'm looking for your help on coming up with a Matix or Table visualization that shows the sum of top 5, top 10 and top 15. I have the following Percentage column that has percentages sorted in descending order which I'm using to solve this issue. I tried doing it myselft but Power BI desktop keep saying that you only can use one TopN from the UI. So, I was thinking maybe there is a way to do it using DAX formula.
Thank you.
Here is the data that can be copied.
| Percentage | ||||||
| 10.31% | ||||||
| 9.65% | ||||||
| 8.62% | ||||||
| 7.85% | ||||||
| 7.80% | ||||||
| 6.74% | ||||||
| 6.10% | ||||||
| 6% | ||||||
| 5.62% | ||||||
| 5.60% | ||||||
| 5.21% | ||||||
| 5.21% | ||||||
| 4.80% | ||||||
| 4.65% | ||||||
| 4.30% | ||||||
| 3.50% | ||||||
| 3.21% | ||||||
| 3.12% | ||||||
| 3.10% | ||||||
| 2.52% | ||||||
| 2.35% | ||||||
| 2.10% | ||||||
| 2% | ||||||
| 1.30% | ||||||
| 1.20% | ||||||
| 0.83% | ||||||
| 0.65% | ||||||
| 0.64% | ||||||
| 0.12% |
Solved! Go to Solution.
- Mark as New
- Bookmark
- Subscribe
- Mute
- Subscribe to RSS Feed
- Permalink
- Report Inappropriate Content
Create a measure for each band as follows:
Top 5 =
SUMX (
    CALCULATETABLE (
        TOPN ( 5, VALUES ( Table[Percentage] ), Table[Percentage], DESC )
    ),
    Table[Percentage]
)
Change 5 with the band size you want for each measure.
- Mark as New
- Bookmark
- Subscribe
- Mute
- Subscribe to RSS Feed
- Permalink
- Report Inappropriate Content
Hi Mohammad, Thank you so much for above DAX query. It's working perfectly for me.
Helpful resources

Microsoft Fabric Learn Together
Covering the world! 9:00-10:30 AM Sydney, 4:00-5:30 PM CET (Paris/Berlin), 7:00-8:30 PM Mexico City

Power BI Monthly Update - April 2024
Check out the April 2024 Power BI update to learn about new features.

| User | Count |
|---|---|
| 107 | |
| 100 | |
| 78 | |
| 64 | |
| 58 |
| User | Count |
|---|---|
| 148 | |
| 113 | |
| 97 | |
| 84 | |
| 67 |

