- Power BI forums
- Updates
- News & Announcements
- Get Help with Power BI
- Desktop
- Service
- Report Server
- Power Query
- Mobile Apps
- Developer
- DAX Commands and Tips
- Custom Visuals Development Discussion
- Health and Life Sciences
- Power BI Spanish forums
- Translated Spanish Desktop
- Power Platform Integration - Better Together!
- Power Platform Integrations (Read-only)
- Power Platform and Dynamics 365 Integrations (Read-only)
- Training and Consulting
- Instructor Led Training
- Dashboard in a Day for Women, by Women
- Galleries
- Community Connections & How-To Videos
- COVID-19 Data Stories Gallery
- Themes Gallery
- Data Stories Gallery
- R Script Showcase
- Webinars and Video Gallery
- Quick Measures Gallery
- 2021 MSBizAppsSummit Gallery
- 2020 MSBizAppsSummit Gallery
- 2019 MSBizAppsSummit Gallery
- Events
- Ideas
- Custom Visuals Ideas
- Issues
- Issues
- Events
- Upcoming Events
- Community Blog
- Power BI Community Blog
- Custom Visuals Community Blog
- Community Support
- Community Accounts & Registration
- Using the Community
- Community Feedback
Register now to learn Fabric in free live sessions led by the best Microsoft experts. From Apr 16 to May 9, in English and Spanish.
- Power BI forums
- Forums
- Get Help with Power BI
- Desktop
- Having trouble with total averages
- Subscribe to RSS Feed
- Mark Topic as New
- Mark Topic as Read
- Float this Topic for Current User
- Bookmark
- Subscribe
- Printer Friendly Page
- Mark as New
- Bookmark
- Subscribe
- Mute
- Subscribe to RSS Feed
- Permalink
- Report Inappropriate Content
Having trouble with total averages
I am trying to build a dataset/model to analyze the utilization rates of codes for office visits. Established office visits can be coded 99212, 99213, 99214, or 99215. Right now my data model is really just a flat table with the following fields.
| Period | NPI | Last Name | First Name | Full Name | CMS Speciality | Primary Taxonomy | Group | Total Est Visits | 99212 Freq | 99213 Freq | 99214 Freq | 99215 Freq |
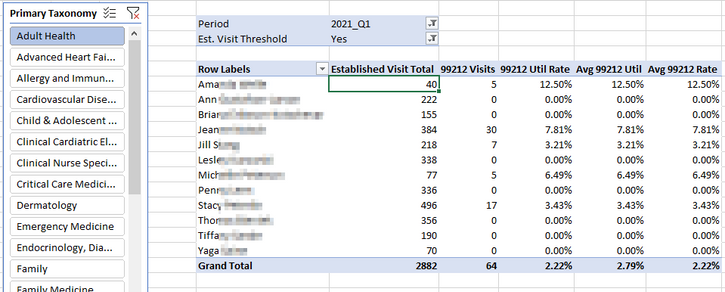
I'm playing around with this in Excel Power Pivot before I work in Power BI. I've created a couple of measures to calculate the utilization rate for each code (i.e. code Freq / Total visits). I want to compare individual provider utilization rates with the average utilization rate for each code. My measures keep giving me row by row rates, not a total rate:
I want a way to calculate the same values in the Grand Total row so that I can make comparisons. Here's what I have tried.
Avg 99212 Util:
= AVERAGE(All_Visits[99212 Rate])
Avg 99212 Rate:
= [Total 99212 Visits] / [Established Visit Total]
Ultimately the goal is to flag providers based on how their utilization rates compare to the average within their primary taxonomy. So, for example, I want to flag provider's whose utilization rate for 99212 is more than 10 percentage points different than the average of provider's in their same grouping, e.g. Adult Health.
Solved! Go to Solution.
- Mark as New
- Bookmark
- Subscribe
- Mute
- Subscribe to RSS Feed
- Permalink
- Report Inappropriate Content
Hi @cathoms ,
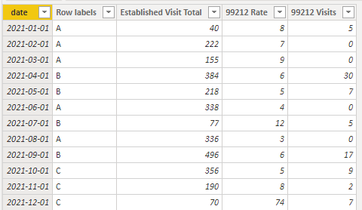
This is the data I created:
Here are the steps you can follow:
1. Create measure.
Measure =
DIVIDE(MAX('All_Visits'[99212 Visits]),MAX('All_Visits'[Established Visit Total]))
Measure 2 =
VAR _1=
SUMX(FILTER(ALL('All_Visits'),'All_Visits'[Row labels]=MAX('All_Visits'[Row labels])),[Established Visit Total])
VAR _2=
SUMX(FILTER(ALL('All_Visits'),'All_Visits'[Row labels]=MAX('All_Visits'[Row labels])),[99212 Visits])
RETURN
DIVIDE(_2,_1)Measure 3 = IF([Measure]<[Measure 2],1,0)
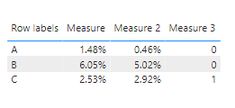
2. Result:
If my answer does not meet your expectations, can you share sample data and sample output in table format? Or a sample pbix after removing sensitive data.
Best Regards,
Liu Yang
If this post helps, then please consider Accept it as the solution to help the other members find it more quickly.
- Mark as New
- Bookmark
- Subscribe
- Mute
- Subscribe to RSS Feed
- Permalink
- Report Inappropriate Content
Hi @cathoms ,
If you want new ideas, you can continue to ask questions.
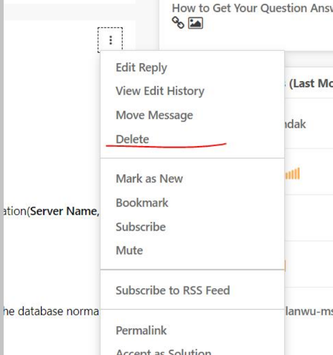
If you want to close the thread, you can select the above ellipsis and select Delete to delete the post.
Best Regards,
Liu Yang
If this post helps, then please consider Accept it as the solution to help the other members find it more quickly.
- Mark as New
- Bookmark
- Subscribe
- Mute
- Subscribe to RSS Feed
- Permalink
- Report Inappropriate Content
Hi @cathoms ,
That's great, you can share sample data and sample output in tabular form, using tabular data or pictures to describe the results you need and detailed intermediate process logic, we can better help you.
Best Regards,
Liu Yang
- Mark as New
- Bookmark
- Subscribe
- Mute
- Subscribe to RSS Feed
- Permalink
- Report Inappropriate Content
This is no longer relevant as the source data file is now different. Not sure how to "close" this thread, however, as there is no solution, per se...
- Mark as New
- Bookmark
- Subscribe
- Mute
- Subscribe to RSS Feed
- Permalink
- Report Inappropriate Content
Hi @cathoms ,
This is the data I created:
Here are the steps you can follow:
1. Create measure.
Measure =
DIVIDE(MAX('All_Visits'[99212 Visits]),MAX('All_Visits'[Established Visit Total]))
Measure 2 =
VAR _1=
SUMX(FILTER(ALL('All_Visits'),'All_Visits'[Row labels]=MAX('All_Visits'[Row labels])),[Established Visit Total])
VAR _2=
SUMX(FILTER(ALL('All_Visits'),'All_Visits'[Row labels]=MAX('All_Visits'[Row labels])),[99212 Visits])
RETURN
DIVIDE(_2,_1)Measure 3 = IF([Measure]<[Measure 2],1,0)
2. Result:
If my answer does not meet your expectations, can you share sample data and sample output in table format? Or a sample pbix after removing sensitive data.
Best Regards,
Liu Yang
If this post helps, then please consider Accept it as the solution to help the other members find it more quickly.
- Mark as New
- Bookmark
- Subscribe
- Mute
- Subscribe to RSS Feed
- Permalink
- Report Inappropriate Content
Thank you. Unfortunately, that did not work. I will try to find time to create and share some sample data and additional details.
- Mark as New
- Bookmark
- Subscribe
- Mute
- Subscribe to RSS Feed
- Permalink
- Report Inappropriate Content
One other more basic question is how I should best set up the data model for this work.
Helpful resources

Microsoft Fabric Learn Together
Covering the world! 9:00-10:30 AM Sydney, 4:00-5:30 PM CET (Paris/Berlin), 7:00-8:30 PM Mexico City

Power BI Monthly Update - April 2024
Check out the April 2024 Power BI update to learn about new features.

| User | Count |
|---|---|
| 109 | |
| 98 | |
| 80 | |
| 64 | |
| 57 |
| User | Count |
|---|---|
| 145 | |
| 111 | |
| 92 | |
| 84 | |
| 66 |


