- Power BI forums
- Updates
- News & Announcements
- Get Help with Power BI
- Desktop
- Service
- Report Server
- Power Query
- Mobile Apps
- Developer
- DAX Commands and Tips
- Custom Visuals Development Discussion
- Health and Life Sciences
- Power BI Spanish forums
- Translated Spanish Desktop
- Power Platform Integration - Better Together!
- Power Platform Integrations (Read-only)
- Power Platform and Dynamics 365 Integrations (Read-only)
- Training and Consulting
- Instructor Led Training
- Dashboard in a Day for Women, by Women
- Galleries
- Community Connections & How-To Videos
- COVID-19 Data Stories Gallery
- Themes Gallery
- Data Stories Gallery
- R Script Showcase
- Webinars and Video Gallery
- Quick Measures Gallery
- 2021 MSBizAppsSummit Gallery
- 2020 MSBizAppsSummit Gallery
- 2019 MSBizAppsSummit Gallery
- Events
- Ideas
- Custom Visuals Ideas
- Issues
- Issues
- Events
- Upcoming Events
- Community Blog
- Power BI Community Blog
- Custom Visuals Community Blog
- Community Support
- Community Accounts & Registration
- Using the Community
- Community Feedback
Register now to learn Fabric in free live sessions led by the best Microsoft experts. From Apr 16 to May 9, in English and Spanish.
- Power BI forums
- Forums
- Get Help with Power BI
- Desktop
- Have Columns as selection to show on visual
- Subscribe to RSS Feed
- Mark Topic as New
- Mark Topic as Read
- Float this Topic for Current User
- Bookmark
- Subscribe
- Printer Friendly Page
- Mark as New
- Bookmark
- Subscribe
- Mute
- Subscribe to RSS Feed
- Permalink
- Report Inappropriate Content
Have Columns as selection to show on visual
Hello,
In my dataset, I have 2 fields "Total Charges", & "Unique Roamers":
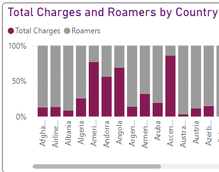
In my 100% Stacked Column Chart, I show both the fields as Values for each Country:
I want to have a selection to show only "Total Charges", or "Unique Roamers", or both by default.
Since they both are not values of a field, I don't think Slicer can work.
Can I have something like a toggle button or some way of selection and reflect that in the chart i.e. Show only "Total Charges", or "Unique Roamers", or both if none is selected.
How can I accomplish this ?
Thanks for any help.
Solved! Go to Solution.
- Mark as New
- Bookmark
- Subscribe
- Mute
- Subscribe to RSS Feed
- Permalink
- Report Inappropriate Content
@Anonymous
Hope this video will help you understand the concept :
https://www.youtube.com/watch?v=_HTF7Ph7Eqc
⭕ Subscribe and learn Power BI from these videos
⚪ Website ⚪ LinkedIn ⚪ PBI User Group
- Mark as New
- Bookmark
- Subscribe
- Mute
- Subscribe to RSS Feed
- Permalink
- Report Inappropriate Content
@Anonymous
If you select one field then you will see 100% for all the countries, I am not sure what is the purpose of a 100% stacked column chart.
You can create 3 Bookmarks where you will create three charts with each scenario
.
⭕ Subscribe and learn Power BI from these videos
⚪ Website ⚪ LinkedIn ⚪ PBI User Group
- Mark as New
- Bookmark
- Subscribe
- Mute
- Subscribe to RSS Feed
- Permalink
- Report Inappropriate Content
Thanks @Fowmy Actually, I wasn't able to add both values; it worked using 100% Column chart, so I went with that.
Yes you are right, if I want ot change it to single column, it shouldn't be 100% col chart. I am not restricted to use 100% col chart.
What do you mean by bookmarks for each scenario ?
- Mark as New
- Bookmark
- Subscribe
- Mute
- Subscribe to RSS Feed
- Permalink
- Report Inappropriate Content
@Anonymous
Hope this video will help you understand the concept :
https://www.youtube.com/watch?v=_HTF7Ph7Eqc
⭕ Subscribe and learn Power BI from these videos
⚪ Website ⚪ LinkedIn ⚪ PBI User Group
- Mark as New
- Bookmark
- Subscribe
- Mute
- Subscribe to RSS Feed
- Permalink
- Report Inappropriate Content
This is a nice way, @Fowmy Thanks for sharing this new concept.
I am concerned about 2 things with this concept:
1. Always I would be having 3 charts loaded with data (though only 1 will be visible). If so, would this affect the performance ?
2. When any of the other chart is shown, will it load data based on any slicers selected ?
Can you help with my concerns?
Do you see any other solution or way to achieve this?
Helpful resources

Microsoft Fabric Learn Together
Covering the world! 9:00-10:30 AM Sydney, 4:00-5:30 PM CET (Paris/Berlin), 7:00-8:30 PM Mexico City

Power BI Monthly Update - April 2024
Check out the April 2024 Power BI update to learn about new features.

| User | Count |
|---|---|
| 117 | |
| 107 | |
| 70 | |
| 70 | |
| 43 |
| User | Count |
|---|---|
| 148 | |
| 106 | |
| 104 | |
| 89 | |
| 65 |


