- Power BI forums
- Updates
- News & Announcements
- Get Help with Power BI
- Desktop
- Service
- Report Server
- Power Query
- Mobile Apps
- Developer
- DAX Commands and Tips
- Custom Visuals Development Discussion
- Health and Life Sciences
- Power BI Spanish forums
- Translated Spanish Desktop
- Power Platform Integration - Better Together!
- Power Platform Integrations (Read-only)
- Power Platform and Dynamics 365 Integrations (Read-only)
- Training and Consulting
- Instructor Led Training
- Dashboard in a Day for Women, by Women
- Galleries
- Community Connections & How-To Videos
- COVID-19 Data Stories Gallery
- Themes Gallery
- Data Stories Gallery
- R Script Showcase
- Webinars and Video Gallery
- Quick Measures Gallery
- 2021 MSBizAppsSummit Gallery
- 2020 MSBizAppsSummit Gallery
- 2019 MSBizAppsSummit Gallery
- Events
- Ideas
- Custom Visuals Ideas
- Issues
- Issues
- Events
- Upcoming Events
- Community Blog
- Power BI Community Blog
- Custom Visuals Community Blog
- Community Support
- Community Accounts & Registration
- Using the Community
- Community Feedback
Register now to learn Fabric in free live sessions led by the best Microsoft experts. From Apr 16 to May 9, in English and Spanish.
- Power BI forums
- Forums
- Get Help with Power BI
- Desktop
- Re: Graph showing Sum of Opened bugs per sprint
- Subscribe to RSS Feed
- Mark Topic as New
- Mark Topic as Read
- Float this Topic for Current User
- Bookmark
- Subscribe
- Printer Friendly Page
- Mark as New
- Bookmark
- Subscribe
- Mute
- Subscribe to RSS Feed
- Permalink
- Report Inappropriate Content
Graph showing Sum of Opened bugs per sprint
Hi
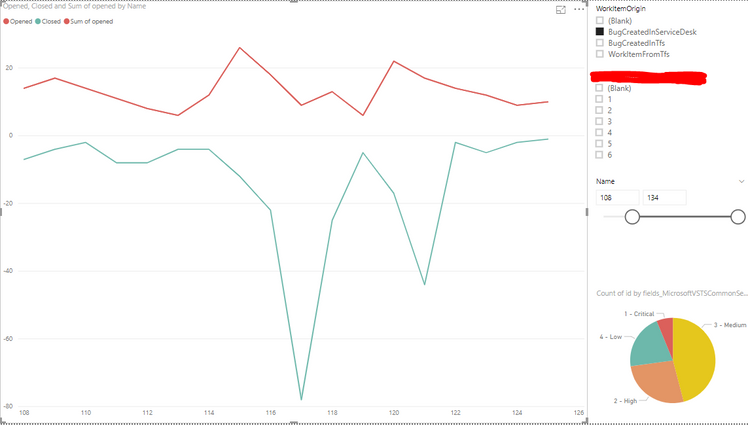
I have a Graph showing Opened and Closed bugs in a sprint. However, I'm also interested in showing Sum of Opened bugs per sprint.
Definition:
Sprint: Has a start and end date e.g. Sprint 108, Sprint 109, Sprint 110 etc. (shown on X-axis)
Opened bugs: All bugs with a CreatedDate (of type WorkItemOrigin=BugCreatedInServiceDesk) between start and end date of a sprint i.e. Bugs Opened in a sprint
Closed bugs: All bugs with a ClosedDate (of type WorkItemOrigin=BugCreatedInServiceDesk) between start and end date of a sprint i.e. Bugs Closed in a sprint
Sum of Opened bugs: All newly Opened bugs (in current sprint) + existing Open bugs (from previous sprints) - Closed bugs (However, I want to retain the history i.e. if Sum of Opened bugs in Sprint 116 is 20, then when current sprint becomes 117, 118, 119 etc. it should still show 20 for Sprint 116) i.e. Sum of all open bugs
Example:
Sprint 1: Opened 4 Closed 2 Sum of Opened 2
Sprint 2: Opened 8 Closed 0 Sum of Opened 10
Sprint 3: Opened 2 Closed 6 Sum of Opened 6
Sprint 4: Opened 3 Closed 5 Sum of Opened 4
Sprint 5: Opened 11 Closed 13 Sum of Opened 2
My relations are as follows:
My formulas:
I have tried the following, but it show the same graph as Opened:
Solved! Go to Solution.
- Mark as New
- Bookmark
- Subscribe
- Mute
- Subscribe to RSS Feed
- Permalink
- Report Inappropriate Content
HI, @Anonymous
Just try this way:
Step1:
Adjust your formula [Closed]
Closed = CALCULATE(
        DISTINCTCOUNT(
            WorkItems[id]),
            WorkItems,WorkItems[Origin]="BugCreatedInServiceDesk",
            USERELATIONSHIP(WorkItems[ClosedDate],SprintDates[Date])
    ,WorkItems[ClosedDate] <>BLANK()
)
Step2:
Create a sum of open measure
Sum of Opened = CALCULATE([Opened],FILTER(ALLSELECTED(SprintDates),SprintDates[Name]<=MAX(SprintDates[Name])))-CALCULATE([Closed],FILTER(ALLSELECTED(SprintDates),SprintDates[Name]<=MAX(SprintDates[Name])))
Result:
Best Regards,
Lin
If this post helps, then please consider Accept it as the solution to help the other members find it more quickly.
- Mark as New
- Bookmark
- Subscribe
- Mute
- Subscribe to RSS Feed
- Permalink
- Report Inappropriate Content
hi, @Anonymous
Could you please share a simple sample pbix for us have a test? Just remove all other columns and with little sample data in it.
You can upload it to OneDrive and post the link here. Do mask sensitive data before uploading.
Please see this post regarding How to Get Your Question Answered Quickly:
https://community.powerbi.com/t5/Community-Blog/How-to-Get-Your-Question-Answered-Quickly/ba-p/38490
Best Regards,
Lin
If this post helps, then please consider Accept it as the solution to help the other members find it more quickly.
- Mark as New
- Bookmark
- Subscribe
- Mute
- Subscribe to RSS Feed
- Permalink
- Report Inappropriate Content
Hi
I have provided a simple sample pbix as requested. I hope it makes sense.
https://1drv.ms/u/s!ApQ3zdo87D7Ia3X8TRAdRijbqhQ?e=3BeKxr
Best regards
Martin
- Mark as New
- Bookmark
- Subscribe
- Mute
- Subscribe to RSS Feed
- Permalink
- Report Inappropriate Content
HI, @Anonymous
Just try this way:
Step1:
Adjust your formula [Closed]
Closed = CALCULATE(
        DISTINCTCOUNT(
            WorkItems[id]),
            WorkItems,WorkItems[Origin]="BugCreatedInServiceDesk",
            USERELATIONSHIP(WorkItems[ClosedDate],SprintDates[Date])
    ,WorkItems[ClosedDate] <>BLANK()
)
Step2:
Create a sum of open measure
Sum of Opened = CALCULATE([Opened],FILTER(ALLSELECTED(SprintDates),SprintDates[Name]<=MAX(SprintDates[Name])))-CALCULATE([Closed],FILTER(ALLSELECTED(SprintDates),SprintDates[Name]<=MAX(SprintDates[Name])))
Result:
Best Regards,
Lin
If this post helps, then please consider Accept it as the solution to help the other members find it more quickly.
- Mark as New
- Bookmark
- Subscribe
- Mute
- Subscribe to RSS Feed
- Permalink
- Report Inappropriate Content
Hi Lin
Thank you so much for you reply and solution. It is much appreciated.
Your solution works perfectly, however I can't seem to understand you formula in step 2. Can you elaborate on why that works? You do something with Opened and then you subtract something with Closed?
Best regards
Martin
Helpful resources

Microsoft Fabric Learn Together
Covering the world! 9:00-10:30 AM Sydney, 4:00-5:30 PM CET (Paris/Berlin), 7:00-8:30 PM Mexico City

Power BI Monthly Update - April 2024
Check out the April 2024 Power BI update to learn about new features.

| User | Count |
|---|---|
| 114 | |
| 99 | |
| 75 | |
| 73 | |
| 49 |
| User | Count |
|---|---|
| 145 | |
| 109 | |
| 109 | |
| 90 | |
| 64 |


