- Power BI forums
- Updates
- News & Announcements
- Get Help with Power BI
- Desktop
- Service
- Report Server
- Power Query
- Mobile Apps
- Developer
- DAX Commands and Tips
- Custom Visuals Development Discussion
- Health and Life Sciences
- Power BI Spanish forums
- Translated Spanish Desktop
- Power Platform Integration - Better Together!
- Power Platform Integrations (Read-only)
- Power Platform and Dynamics 365 Integrations (Read-only)
- Training and Consulting
- Instructor Led Training
- Dashboard in a Day for Women, by Women
- Galleries
- Community Connections & How-To Videos
- COVID-19 Data Stories Gallery
- Themes Gallery
- Data Stories Gallery
- R Script Showcase
- Webinars and Video Gallery
- Quick Measures Gallery
- 2021 MSBizAppsSummit Gallery
- 2020 MSBizAppsSummit Gallery
- 2019 MSBizAppsSummit Gallery
- Events
- Ideas
- Custom Visuals Ideas
- Issues
- Issues
- Events
- Upcoming Events
- Community Blog
- Power BI Community Blog
- Custom Visuals Community Blog
- Community Support
- Community Accounts & Registration
- Using the Community
- Community Feedback
Register now to learn Fabric in free live sessions led by the best Microsoft experts. From Apr 16 to May 9, in English and Spanish.
- Power BI forums
- Forums
- Get Help with Power BI
- Desktop
- Gantt chart task bar visualized earlier than start...
- Subscribe to RSS Feed
- Mark Topic as New
- Mark Topic as Read
- Float this Topic for Current User
- Bookmark
- Subscribe
- Printer Friendly Page
- Mark as New
- Bookmark
- Subscribe
- Mute
- Subscribe to RSS Feed
- Permalink
- Report Inappropriate Content
Gantt chart task bar visualized earlier than start and end dates
Hi Everyone,
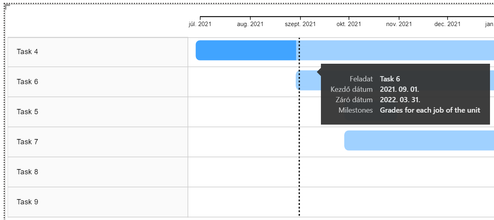
I'm trying to create a Gantt chart using Gantt 2.2.3, but the bars are visualized earlier than the actual start/end dates.
Even though the highlighted start date is 2021.09.01 the bar extends even before today. It looks like the bars are early 1-2 days and this even affects the line showing today. I checked all of my regional/time zone settings in Windows and everything seems to be correctly aligned. I tried changing something in Power BI itself, but couldn't find any options. I also tried looking everywhere, but it seems like nobody had this kind of problem.
I checked the data and even though I imported the table from one Excel sheet the dates seem to have different time zones for some inexplicable reason:
However, I'm not sure if this is the cause of the problem.
I'm completely flabbergasted so any help is much appreciated!
Thanks in advance!
Solved! Go to Solution.
- Mark as New
- Bookmark
- Subscribe
- Mute
- Subscribe to RSS Feed
- Permalink
- Report Inappropriate Content
Hi @Anonymous
In Power BI report, there are only date and date/time data types. Neither of them has timezone info. So transform start date and end date columns in Power Query Editor to a specific timezone you want. Or change them to date type if you don't need to use time and timezone data.
For the "bar extends before the start date" issue, I can reproduce it. I think it is due to the bar is not a standard rectangle shape. It extends at the head as well as at the tail. Not sure when the shape started to change, but from its original glance pictures on this page, it was a rectangle before.
As Gantt 2.2.3 hasn't been updated since 2017, you could try some new Gantt custom visuals which may not have this problem.
Best Regards,
Community Support Team _ Jing
- Mark as New
- Bookmark
- Subscribe
- Mute
- Subscribe to RSS Feed
- Permalink
- Report Inappropriate Content
Thanks Jing for checking! I'll use another Gantt visualisation then 🙂
Helpful resources

Microsoft Fabric Learn Together
Covering the world! 9:00-10:30 AM Sydney, 4:00-5:30 PM CET (Paris/Berlin), 7:00-8:30 PM Mexico City

Power BI Monthly Update - April 2024
Check out the April 2024 Power BI update to learn about new features.

| User | Count |
|---|---|
| 111 | |
| 100 | |
| 80 | |
| 64 | |
| 58 |
| User | Count |
|---|---|
| 148 | |
| 111 | |
| 93 | |
| 84 | |
| 66 |


