- Power BI forums
- Updates
- News & Announcements
- Get Help with Power BI
- Desktop
- Service
- Report Server
- Power Query
- Mobile Apps
- Developer
- DAX Commands and Tips
- Custom Visuals Development Discussion
- Health and Life Sciences
- Power BI Spanish forums
- Translated Spanish Desktop
- Power Platform Integration - Better Together!
- Power Platform Integrations (Read-only)
- Power Platform and Dynamics 365 Integrations (Read-only)
- Training and Consulting
- Instructor Led Training
- Dashboard in a Day for Women, by Women
- Galleries
- Community Connections & How-To Videos
- COVID-19 Data Stories Gallery
- Themes Gallery
- Data Stories Gallery
- R Script Showcase
- Webinars and Video Gallery
- Quick Measures Gallery
- 2021 MSBizAppsSummit Gallery
- 2020 MSBizAppsSummit Gallery
- 2019 MSBizAppsSummit Gallery
- Events
- Ideas
- Custom Visuals Ideas
- Issues
- Issues
- Events
- Upcoming Events
- Community Blog
- Power BI Community Blog
- Custom Visuals Community Blog
- Community Support
- Community Accounts & Registration
- Using the Community
- Community Feedback
Register now to learn Fabric in free live sessions led by the best Microsoft experts. From Apr 16 to May 9, in English and Spanish.
- Power BI forums
- Forums
- Get Help with Power BI
- Desktop
- For line and column chart, how to write measure to...
- Subscribe to RSS Feed
- Mark Topic as New
- Mark Topic as Read
- Float this Topic for Current User
- Bookmark
- Subscribe
- Printer Friendly Page
- Mark as New
- Bookmark
- Subscribe
- Mute
- Subscribe to RSS Feed
- Permalink
- Report Inappropriate Content
For line and column chart, how to write measure to show STRAIGHT line that's 10% of sum of all sales
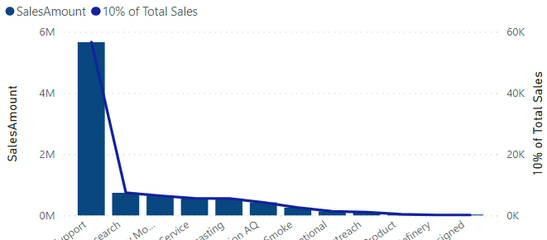
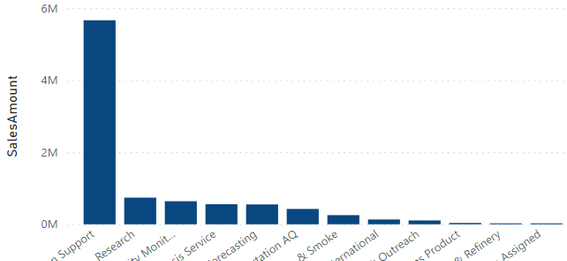
This is the line and column chart I want to add a straight (constant) 10% of total sales target. The idea being that I want to show KPI metric of one of the business segments (represented by each bar) to see if it has achieved 10% of total sales.
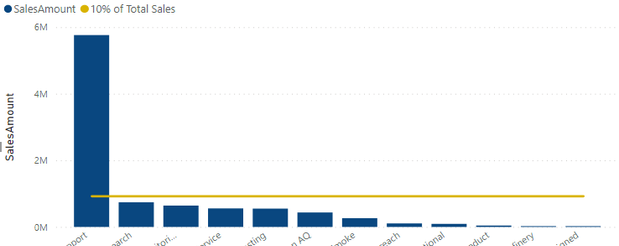
The chart below is similar to what I want it to look like: (I was able to make the below chart by creating a separate Field that references an Excel table and formula to create a constant (straight line) reflecting 10% of COUNT of Projects. But I want to achieve this straight line for Sales Amount (above) in Power BI, not excel. And then eventually apply that DAX formula to this below Count chart as well)
However, when I tried these various measures:

I thought maybe going in to Format > Y-axis > Un-Show secondary axis might work but it did not.
How can I write his measure so there is a straight line across the chart representing 10% of the sum of all the values in the bar chart?
Thank you!
Solved! Go to Solution.
- Mark as New
- Bookmark
- Subscribe
- Mute
- Subscribe to RSS Feed
- Permalink
- Report Inappropriate Content
FYI that you don't need the CALCULATE in your expressions, unless you are changing the filter context. That is needed as shown below, but it isn't for simple SUM( ) expressions. To do that calculation, you need to remove the filter that is coming from the visual (the column used as the categories on your x axis).
10% of Total Sales = CALCULATE(SUM('CONT-ProjectBillingInvoices'[10% Target]), REMOVEFILTERS(Table[ColumnOnXaxis])*.1
Pat
Did I answer your question? Mark my post as a solution! Kudos are also appreciated!
To learn more about Power BI, follow me on Twitter or subscribe on YouTube.
@mahoneypa HoosierBI on YouTube
- Mark as New
- Bookmark
- Subscribe
- Mute
- Subscribe to RSS Feed
- Permalink
- Report Inappropriate Content
Thank you, Pat. After some tweaking, that worked!! (The measures I shared in my post were two of many iterations, and it had devolved into some totally off and I rushed what I copied in...so thank you for pointing some of those out)
For context if you're interested or for those finding this post:
I tried your suggestion with REMOVEFILTERS on my x-axis [Business Area]. I also replaced the '10% Target' with 'SalesAmount' since that was a numeric calcuated column I had created to get 10% of each project Sales amount, so summing those 10% values AND multiplying by .1 is reduncant:
This is the error I got at first:
So I tried removing the *.1 at the end and putting my '10% Target' calculated column back and that worked.
That first bar throws off the aesthetic of the whole thing, but this visual definitely achieves it's purpose now. (No other Busines Area has achieved 10% of Total Sales.)
Thank you, Pat!
Helpful resources

Microsoft Fabric Learn Together
Covering the world! 9:00-10:30 AM Sydney, 4:00-5:30 PM CET (Paris/Berlin), 7:00-8:30 PM Mexico City

Power BI Monthly Update - April 2024
Check out the April 2024 Power BI update to learn about new features.

| User | Count |
|---|---|
| 117 | |
| 107 | |
| 69 | |
| 68 | |
| 43 |
| User | Count |
|---|---|
| 148 | |
| 104 | |
| 102 | |
| 88 | |
| 66 |


