- Power BI forums
- Updates
- News & Announcements
- Get Help with Power BI
- Desktop
- Service
- Report Server
- Power Query
- Mobile Apps
- Developer
- DAX Commands and Tips
- Custom Visuals Development Discussion
- Health and Life Sciences
- Power BI Spanish forums
- Translated Spanish Desktop
- Power Platform Integration - Better Together!
- Power Platform Integrations (Read-only)
- Power Platform and Dynamics 365 Integrations (Read-only)
- Training and Consulting
- Instructor Led Training
- Dashboard in a Day for Women, by Women
- Galleries
- Community Connections & How-To Videos
- COVID-19 Data Stories Gallery
- Themes Gallery
- Data Stories Gallery
- R Script Showcase
- Webinars and Video Gallery
- Quick Measures Gallery
- 2021 MSBizAppsSummit Gallery
- 2020 MSBizAppsSummit Gallery
- 2019 MSBizAppsSummit Gallery
- Events
- Ideas
- Custom Visuals Ideas
- Issues
- Issues
- Events
- Upcoming Events
- Community Blog
- Power BI Community Blog
- Custom Visuals Community Blog
- Community Support
- Community Accounts & Registration
- Using the Community
- Community Feedback
Register now to learn Fabric in free live sessions led by the best Microsoft experts. From Apr 16 to May 9, in English and Spanish.
- Power BI forums
- Forums
- Get Help with Power BI
- Desktop
- Re: Filter for a chain of related values
- Subscribe to RSS Feed
- Mark Topic as New
- Mark Topic as Read
- Float this Topic for Current User
- Bookmark
- Subscribe
- Printer Friendly Page
- Mark as New
- Bookmark
- Subscribe
- Mute
- Subscribe to RSS Feed
- Permalink
- Report Inappropriate Content
Filter for a chain of related values
Hi all, just need some help for a seemingly simple problem that I cannot wrap my head around.
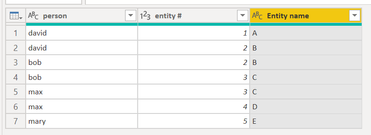
I have a model where users are connected to different entities. The main data table looks as follows:
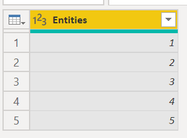
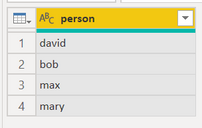
I want to display in a matrix, the people on the rows and the entities on the column. The values are to display the entity names. For this purpose I have created 2 key tables, one for the people and one for the entity numbers which have a one to many relationship with the main data table above:
I then dragged the person key table column into the matrix rows, and the entities key table column into the matrix columns. Dragging the the main data table "entity name" column into the matrix values yields the following:
Now, the business requirement is to be able to select an entity in a slicer, and for the matrix to show all the people in the selected entity, but also show the all the other entities that these people are connected to. To do this, I made a second entities key table which has no relationships with the model (I will refer to this table as "entities unrelated"), and wrote the following measures:
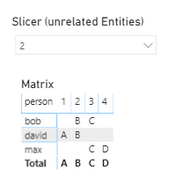
The slicer uses the entity key table which has no relationships to the model. Basically, the "entities count" measure checks if there is an entity selected in the slicer, and if so counts the rows for those people who are part of the selected entity, but also counts all the rows for the all other entities they are connected to (only if they are indeed a part of the selected entity). The sumx measure is employed to get the totals right. I then drag the sumx measure into my matrix filters and set it to "is not blank". The result, for example, if I select 2 in the slicer is as follows:
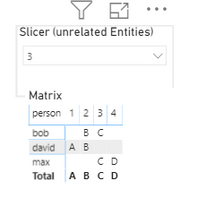
This is correct, becuase only bob and david are connected to entity 2, but they are also connected to entities 3 and 1 respectively, which are indeed shown in the matrix. My issue however is as follows. I need to make a separate table where when an entity is selected in the slicer, all the people and entities which are "linked" to the selected entity are to be shown, even if they are not directly linked as in my previous exercise. For example, in my model, david is connected to entities 1 and 2, bob to entities 2 and 3, and max to entities 3 and 4. Mary is only connected to entity 5. When selecting entity 1,2,3 or 4 in the slicer I would like the matrix to show david, bob and max in the rows, and entities 1, 2, 3 and 4 in the columns but not Mary or entity 5, as she is on her own and there are no overlapping entity connections. i.e. David is in entities 1 and 2, bob is also in entity 2 but also in entity C, max is also in entity C but also in entity D). This would be the desired result:
How could I achieve this? Many thanks for anyones help 🙂
- Mark as New
- Bookmark
- Subscribe
- Mute
- Subscribe to RSS Feed
- Permalink
- Report Inappropriate Content
" I need to make a separate table where when an entity is selected in the slicer, all the people and entities which are "linked" to the selected entity are to be shown, even if they are not directly linked as in my previous exercise."
the way I would interpret this is you need a measure that will list all the people connected to an entity (which you will use to supply the row headers)
then you need a measure that will list all the entities that have people in them that are in the list returned by the first measure (which you will use to supply the column headers)
Did this post answer your question? Mark it as a solution so others can find it!
Help when you know. Ask when you don't!
Join the conversation at We Talk BI find out more about me at Slow BI
- Mark as New
- Bookmark
- Subscribe
- Mute
- Subscribe to RSS Feed
- Permalink
- Report Inappropriate Content
Hi kentyler! Thank you for your response!
I'm slightly confused - any chance you could elaborate on the measures you are describing, or do you have any potential DAX examples in mind? Thank you!!
Helpful resources

Microsoft Fabric Learn Together
Covering the world! 9:00-10:30 AM Sydney, 4:00-5:30 PM CET (Paris/Berlin), 7:00-8:30 PM Mexico City

Power BI Monthly Update - April 2024
Check out the April 2024 Power BI update to learn about new features.

| User | Count |
|---|---|
| 109 | |
| 98 | |
| 77 | |
| 66 | |
| 54 |
| User | Count |
|---|---|
| 144 | |
| 104 | |
| 101 | |
| 86 | |
| 64 |
