- Power BI forums
- Updates
- News & Announcements
- Get Help with Power BI
- Desktop
- Service
- Report Server
- Power Query
- Mobile Apps
- Developer
- DAX Commands and Tips
- Custom Visuals Development Discussion
- Health and Life Sciences
- Power BI Spanish forums
- Translated Spanish Desktop
- Power Platform Integration - Better Together!
- Power Platform Integrations (Read-only)
- Power Platform and Dynamics 365 Integrations (Read-only)
- Training and Consulting
- Instructor Led Training
- Dashboard in a Day for Women, by Women
- Galleries
- Community Connections & How-To Videos
- COVID-19 Data Stories Gallery
- Themes Gallery
- Data Stories Gallery
- R Script Showcase
- Webinars and Video Gallery
- Quick Measures Gallery
- 2021 MSBizAppsSummit Gallery
- 2020 MSBizAppsSummit Gallery
- 2019 MSBizAppsSummit Gallery
- Events
- Ideas
- Custom Visuals Ideas
- Issues
- Issues
- Events
- Upcoming Events
- Community Blog
- Power BI Community Blog
- Custom Visuals Community Blog
- Community Support
- Community Accounts & Registration
- Using the Community
- Community Feedback
Register now to learn Fabric in free live sessions led by the best Microsoft experts. From Apr 16 to May 9, in English and Spanish.
- Power BI forums
- Forums
- Get Help with Power BI
- Desktop
- Filter for 2nd highest volume product, and display...
- Subscribe to RSS Feed
- Mark Topic as New
- Mark Topic as Read
- Float this Topic for Current User
- Bookmark
- Subscribe
- Printer Friendly Page
- Mark as New
- Bookmark
- Subscribe
- Mute
- Subscribe to RSS Feed
- Permalink
- Report Inappropriate Content
Filter for 2nd highest volume product, and display chart
Dear Power BI Community,
I am new to DAX, and have trouble solving an issue even after reading posts about this matter.
I intend to Filter for the Products which rank 2nd based on volume.
After which, a chart needs to be displayed, showing the average of values.
From other posts, the solution seems to be a combination of RANKX and COUNTROWS.
However, I have not been able to obtain the correct result.
Attached are pictures of the dataset and report.
Dataset
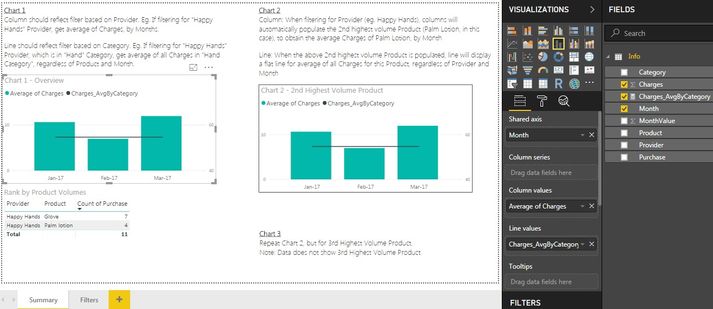
Report, with instructions
Code which I used in Chart 1
Charges_AvgByCategory = CALCULATE(AVERAGEX(Info,Info[Charges]),ALLEXCEPT(Info,Info[Category]))
Thanks for reading my post, and thanks in advance for your help!!
Solved! Go to Solution.
- Mark as New
- Bookmark
- Subscribe
- Mute
- Subscribe to RSS Feed
- Permalink
- Report Inappropriate Content
Hi @Anonymous,
Column: When filtering for Provider (eg. Happy Hands), columns will automatically populate the 2nd highest volume Product (Palm Lotion, in this case), to obtain the average Charges of Palm Lotion, by Month
Please create below measures:
average = AVERAGE(Info[Charges])
rank = RANKX(ALL(Info[Product]),[average],,DESC,Dense)
In chart visual, add [Month] to axis, add [Product] to legend, and add measure [average] to value. Place [rank] to visual level filter and set its value to 2.
Line: When the above 2nd highest volume Product is populated, line will display a flat line for average of all Charges for this Product, regardless of Provider and Month
I'm afraid this is not achievable. As when you filter dataset by provider "Happy Hands", the records are restricted those highlighted in red. It is not possible to take the blue parts into account to calculate average.
Best regards,
Yuliana Gu
If this post helps, then please consider Accept it as the solution to help the other members find it more quickly.
- Mark as New
- Bookmark
- Subscribe
- Mute
- Subscribe to RSS Feed
- Permalink
- Report Inappropriate Content
Hi Yuliana,
Thanks for the solution to the first question, and for explaining the limitations that will occur for the second question!
It was a great help!
Regards,
StratVar
- Mark as New
- Bookmark
- Subscribe
- Mute
- Subscribe to RSS Feed
- Permalink
- Report Inappropriate Content
please share your pbix file. Upload the file to onedrive and dropbox and share the link.
Regards,
Tom
Did I answer your question? Mark my post as a solution, this will help others!
Proud to be a Super User!
I accept Kudos 😉
Hamburg, Germany
- Mark as New
- Bookmark
- Subscribe
- Mute
- Subscribe to RSS Feed
- Permalink
- Report Inappropriate Content
Helpful resources

Microsoft Fabric Learn Together
Covering the world! 9:00-10:30 AM Sydney, 4:00-5:30 PM CET (Paris/Berlin), 7:00-8:30 PM Mexico City

Power BI Monthly Update - April 2024
Check out the April 2024 Power BI update to learn about new features.

| User | Count |
|---|---|
| 113 | |
| 97 | |
| 84 | |
| 67 | |
| 60 |
| User | Count |
|---|---|
| 150 | |
| 120 | |
| 99 | |
| 87 | |
| 68 |


