Register now to learn Fabric in free live sessions led by the best Microsoft experts. From Apr 16 to May 9, in English and Spanish.
I tried to figure this one myself to no luck and couldn't find similar problem through Google.
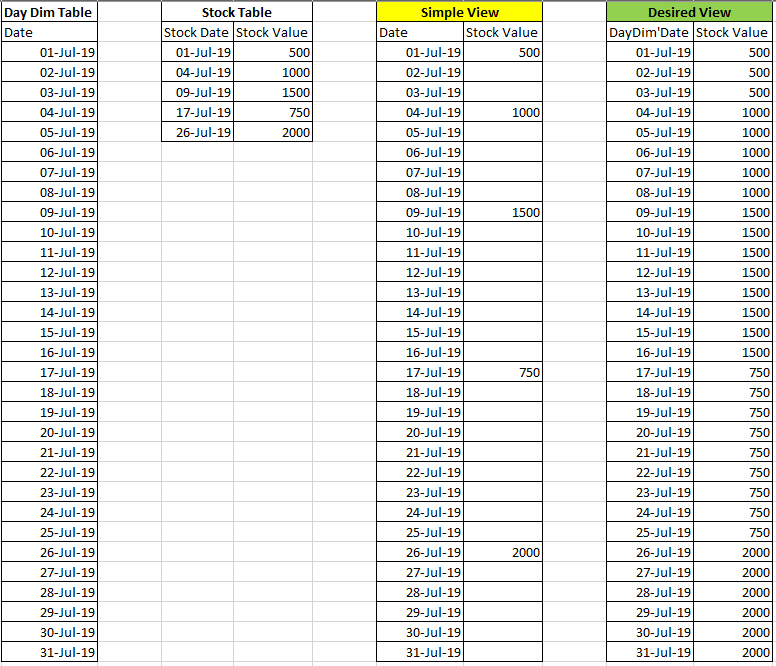
I have a number of tables within PowerBI dashboard, one table is a stock table that has values for random dates throughout the month, what i am trying to figure out is, how can i use dates from DayDim table(that has all dates for a month) in a table view and have a measure that would fill in missing dates with the most recent value from the stock table.
Please see a simplified representation as per image below.
Of course in that stock table i have numerous products and customers etc. for each of those dates, so i would need to have the ability to still calculate values within those contexts, rather than just a total value number.
any help greatly appreciated, thank you in advance.
I have also uploaded a simplified PBIX file to my Google Drive if that helps: https://drive.google.com/open?id=1oai8T0w8T2LWrCoRqQGJhglZEHHRcloo
Hi @Raugmor ,
I found that the pbix file you shared is different from your description, as a result, I produce a pbix file with your sample data, please refer to the following DAX query:
Stock Value = LOOKUPVALUE ( 'Stock Table'[Stock Value], 'Stock Table'[Stock Date], CALCULATE ( MAX ( 'Stock Table'[Stock Date] ), FILTER ( ALL ( 'Stock Table' ), 'Stock Table'[Stock Date] <= EARLIER ( 'Day Dim Table'[Date] ) ) ) )
The result will like below:
Please refer to the following pbix file: https://1drv.ms/u/s!AjytBuzIG5m9tQtryLpVyOxOTWzv
Best Regards,
Teige
Hi, thank you for your reply.
I probably oversimplified the example in actual post(the PBIX i attached is closer to what i require): stock table has various lines for the same day, i.e. different products, and i would need to be able to calculate values within those context/filters. the reason behind this kind of duplication is because i have a bunch of other tables(in actual PBI i am developing) for each date and i am doing a table on all tables in one view, and with this set having gaps i cannot represent data in one table showing all other daily data set tables and the stock value for the missing dates AND being able to filter on particular product/customer.
Apologies for the confusion.
Covering the world! 9:00-10:30 AM Sydney, 4:00-5:30 PM CET (Paris/Berlin), 7:00-8:30 PM Mexico City
Check out the April 2024 Power BI update to learn about new features.
User | Count |
---|---|
112 | |
100 | |
80 | |
64 | |
57 |
User | Count |
---|---|
146 | |
110 | |
93 | |
84 | |
67 |