- Power BI forums
- Updates
- News & Announcements
- Get Help with Power BI
- Desktop
- Service
- Report Server
- Power Query
- Mobile Apps
- Developer
- DAX Commands and Tips
- Custom Visuals Development Discussion
- Health and Life Sciences
- Power BI Spanish forums
- Translated Spanish Desktop
- Power Platform Integration - Better Together!
- Power Platform Integrations (Read-only)
- Power Platform and Dynamics 365 Integrations (Read-only)
- Training and Consulting
- Instructor Led Training
- Dashboard in a Day for Women, by Women
- Galleries
- Community Connections & How-To Videos
- COVID-19 Data Stories Gallery
- Themes Gallery
- Data Stories Gallery
- R Script Showcase
- Webinars and Video Gallery
- Quick Measures Gallery
- 2021 MSBizAppsSummit Gallery
- 2020 MSBizAppsSummit Gallery
- 2019 MSBizAppsSummit Gallery
- Events
- Ideas
- Custom Visuals Ideas
- Issues
- Issues
- Events
- Upcoming Events
- Community Blog
- Power BI Community Blog
- Custom Visuals Community Blog
- Community Support
- Community Accounts & Registration
- Using the Community
- Community Feedback
Register now to learn Fabric in free live sessions led by the best Microsoft experts. From Apr 16 to May 9, in English and Spanish.
- Power BI forums
- Forums
- Get Help with Power BI
- Desktop
- Dynamic % of change for multiple categories based ...
- Subscribe to RSS Feed
- Mark Topic as New
- Mark Topic as Read
- Float this Topic for Current User
- Bookmark
- Subscribe
- Printer Friendly Page
- Mark as New
- Bookmark
- Subscribe
- Mute
- Subscribe to RSS Feed
- Permalink
- Report Inappropriate Content
Dynamic % of change for multiple categories based on dynamic date slicer
Hi everyone,
I’m looking for a solution to calculate / visualize the % of change, however not based on a fixed time period like day, month or year but rather on a dynamic timeslot set by a date-based slicer.
Exemplary scenario: % of change of several stock market data within a dynamic timeslot.
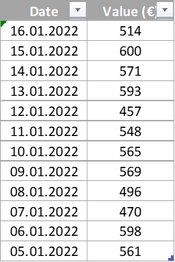
In a table with only one category (e.g. one stock) I’ve managed to realise this as follows.
- Exemplary table:
I've set up 3 Measures:
- Value at Max Date = LOOKUPVALUE(Table1[Value],Table1[Date],MAX(Table1[Date]))
- Value at Min Date = LOOKUPVALUE(Table1[Value],Table1[Date],MIN(Table1[Date]))
- % Change = (Table1[Value at Max Date]-Table1[Value at Min Date])/ Table1[Value at Min Date]
With these measures, I was able to get a dynamic % of change depending on the selected timeslot, e.g. -8.4 % for the time between 05.01. and 16.01.2022 and 27.7 % for the time between 07.01. and 15.01.2022.
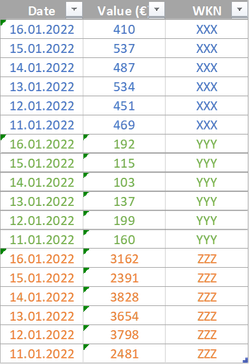
Now, I also have tables where several stocks are summarized within one table as follows:
Here, I’d like to do the same.
In case no stock category filter is set, I’d like to have the weighted average % of change for all stocks.
In case a specific stock is selected by a filter (e.g. XXX), it should show only % of change for this specific stock.
The LOOKUPVALUE formular doesn’t work here, since there are multiple results for each max and min dates (one for each stock category), eventually leading to an error. MI'll probably need kind of a sub-table with the values for all min and max dates for each category. However – these min and max dates need to be dynamic according to my date slicer.
I hope this clarifies what I’m looking for.
Do you have any suggestions how to set up a measure / DAX formula for this situation?
Many thanks in advance! 🙂
Solved! Go to Solution.
- Mark as New
- Bookmark
- Subscribe
- Mute
- Subscribe to RSS Feed
- Permalink
- Report Inappropriate Content
Hi @_MoBa_
That's what I was afraid of...the error was something about row context that didn't exist.
With the data you provided, I re-did the measure. Major changes but it calculates for multiple values. Also added what I think you want for the weighting...each (change in WKN multiplied by weighting) / (starting value multiplied by sum of all weighting)
Here's the code and the pbix is attached.
Measure =
VAR StockData=
    ADDCOLUMNS(
        VALUES(Table2[WKN]),
        "Startwert",
        CALCULATE(
            FIRSTNONBLANK(
                Table1[Value],
                TRUE() = TRUE()
            ),
            Table1[Date] = MIN('Calendar'[Date])
        ),
        "Endwert",
        CALCULATE(
            FIRSTNONBLANK(
                Table1[Value],
                TRUE() = TRUE()
            ),
            Table1[Date] = MAX('Calendar'[Date])
        ),
        "Ratio",
        LOOKUPVALUE(
            Table2[Ratio],
            Table2[WKN],
            Table2[WKN]
        )
    )
RETURN

AVERAGEX(
    StockData,
    DIVIDE(
        ([Endwert] - [Startwert]) * [Ratio],
        [Startwert] * SUMX(StockData, [Ratio])
    )
)
- Mark as New
- Bookmark
- Subscribe
- Mute
- Subscribe to RSS Feed
- Permalink
- Report Inappropriate Content
@_MoBa_ I should have been more clear. You can remove the lookup for Ratio because it's already in Table2.
Measure =
VAR StockData=
    ADDCOLUMNS(
        Table2,
        "Startwert",
        CALCULATE(
            FIRSTNONBLANK(
                Table1[Value],
                TRUE() = TRUE()
            ),
            Table1[Date] = MIN('Calendar'[Date])
        ),
        "Endwert",
        CALCULATE(
            FIRSTNONBLANK(
                Table1[Value],
                TRUE() = TRUE()
            ),
            Table1[Date] = MAX('Calendar'[Date])
        )
    )
RETURN

AVERAGEX(
    StockData,
    DIVIDE(
        ([Endwert] - [Startwert]) * Table2[Ratio],
        [Startwert] * SUMX(StockData, Table2[Ratio])
    )
)- Mark as New
- Bookmark
- Subscribe
- Mute
- Subscribe to RSS Feed
- Permalink
- Report Inappropriate Content
Hi @_MoBa_.
Try this measure.
VAR	StockSummary =
	ADDCOLUMNS(
		VALUES(Stocks[Tickers]),
		"StartingValue",
		LOOKUPVALUE(
			Stocks[Price],
			Stocks[Date],
			FIRSTDATE([Dates]),
			Stocks[Ticker],
			SELECTEDVALUE(Stocks[Ticker]
		),
		"EndingValue",
		LOOKUPVALUE(
			Stocks[Price],
			Stocks[Date],
			LASTDATE([Dates]),
			Stocks[Ticker],
			SELECTEDVALUE(Stocks[Ticker]
		)
	)
RETURN

AVERAGEX(
	StockSummary,
	DIVIDE(
		EndingValue - StartingValue,
		StartingValue,
		BLANK()
	)
)
If you filter for a single stock, it will calculate for only that stock, otherwise it will calculate for all. You never explained how a weighted average would be weighted, so this is going to provide a straight average. I should add that I typed this in Notepad so it's probably not syntactically perfect, but should get you where you want to go.
Hope this helps!
- Mark as New
- Bookmark
- Subscribe
- Mute
- Subscribe to RSS Feed
- Permalink
- Report Inappropriate Content
Thank you so much, I'm totally impressed!
This already brought perfect results when filtering for a single stock!
However, without filter (or when filtering for more than one stocks) it shows blank values instead of the calculated average for all stocks. I didn't recognize the bug, though.
Also, as you also mentioned, I didn't specify further how the average should be weighted. Therefore, I added a further column "Ratio" within the measure as follows:
Do you have a suggestion how to calculate a weighted average based on this additional ratio-data?
Thanks a lot!
- Mark as New
- Bookmark
- Subscribe
- Mute
- Subscribe to RSS Feed
- Permalink
- Report Inappropriate Content
Hi @_MoBa_. I have a good idea what the problem is...there's more than one SELECTEDVALUE(WKN) so it doesn't know what to use. I have an idea how to fix it, but at the same time I would hate to say "try this...now try this..." if it doesn't work. Any way you can share the pbix? (If not, try replacing SELECTEDVALUE() with EARLIER()) This is what happens when you write solutions in Notepad without being able to try them out ☹️
To weight them by the ratio, I would assume multiply the ratio by (ending - starting) but can't be completely sure because I don't know enough about the business problem.
- Mark as New
- Bookmark
- Subscribe
- Mute
- Subscribe to RSS Feed
- Permalink
- Report Inappropriate Content
- Mark as New
- Bookmark
- Subscribe
- Mute
- Subscribe to RSS Feed
- Permalink
- Report Inappropriate Content
Hi @littlemojopuppy ,
it didn't work with EARLIER () as it led to a syntax error.
I've set up a pbix file with dummy data that demonstrates the situation. Maybe this helps to figure out a solution?
Many thanks in advance!!
- Mark as New
- Bookmark
- Subscribe
- Mute
- Subscribe to RSS Feed
- Permalink
- Report Inappropriate Content
Hi @_MoBa_
That's what I was afraid of...the error was something about row context that didn't exist.
With the data you provided, I re-did the measure. Major changes but it calculates for multiple values. Also added what I think you want for the weighting...each (change in WKN multiplied by weighting) / (starting value multiplied by sum of all weighting)
Here's the code and the pbix is attached.
Measure =
VAR StockData=
    ADDCOLUMNS(
        VALUES(Table2[WKN]),
        "Startwert",
        CALCULATE(
            FIRSTNONBLANK(
                Table1[Value],
                TRUE() = TRUE()
            ),
            Table1[Date] = MIN('Calendar'[Date])
        ),
        "Endwert",
        CALCULATE(
            FIRSTNONBLANK(
                Table1[Value],
                TRUE() = TRUE()
            ),
            Table1[Date] = MAX('Calendar'[Date])
        ),
        "Ratio",
        LOOKUPVALUE(
            Table2[Ratio],
            Table2[WKN],
            Table2[WKN]
        )
    )
RETURN

AVERAGEX(
    StockData,
    DIVIDE(
        ([Endwert] - [Startwert]) * [Ratio],
        [Startwert] * SUMX(StockData, [Ratio])
    )
)
- Mark as New
- Bookmark
- Subscribe
- Mute
- Subscribe to RSS Feed
- Permalink
- Report Inappropriate Content
Thank you so much @littlemojopuppy
This looks like the perfect solution!
However, in my real data table the LOOKUPVALUE formula won't accept the third parameter as it did in the dummy data example.
In my table, [WKN] turns grey, not blue... it seems that it won't accept a column but only a scalar value as search value.
I can't find the reason for this as the table structures are identical - do you have any idea?
- Mark as New
- Bookmark
- Subscribe
- Mute
- Subscribe to RSS Feed
- Permalink
- Report Inappropriate Content
@_MoBa_ here's what you can do...
First, right after ADDCOLUMNS change VALUES(Table2[WKN]) to simply Table2. The field WKN already exists in the table so there's no need to look it up.
Let me know what happens.
- Mark as New
- Bookmark
- Subscribe
- Mute
- Subscribe to RSS Feed
- Permalink
- Report Inappropriate Content
@littlemojopuppy unfortunately, this didn't help.
It's still the same in the LOOKUPVALUE formula.
- Mark as New
- Bookmark
- Subscribe
- Mute
- Subscribe to RSS Feed
- Permalink
- Report Inappropriate Content
@_MoBa_ I should have been more clear. You can remove the lookup for Ratio because it's already in Table2.
Measure =
VAR StockData=
    ADDCOLUMNS(
        Table2,
        "Startwert",
        CALCULATE(
            FIRSTNONBLANK(
                Table1[Value],
                TRUE() = TRUE()
            ),
            Table1[Date] = MIN('Calendar'[Date])
        ),
        "Endwert",
        CALCULATE(
            FIRSTNONBLANK(
                Table1[Value],
                TRUE() = TRUE()
            ),
            Table1[Date] = MAX('Calendar'[Date])
        )
    )
RETURN

AVERAGEX(
    StockData,
    DIVIDE(
        ([Endwert] - [Startwert]) * Table2[Ratio],
        [Startwert] * SUMX(StockData, Table2[Ratio])
    )
)- Mark as New
- Bookmark
- Subscribe
- Mute
- Subscribe to RSS Feed
- Permalink
- Report Inappropriate Content
I finally found my mistake - I've accidently selected FIRSTNONBLANKVALUE instead of FIRSTNONBLANK.
Now it's working almost perfectly - THANK YOU so much!!
Only the calculation of the weighted meadn doesn't seem to be the correct formula yet since the resulting values are lower than they should be as soon as more than one category is selected. However, I'll try to figure out a solution for that, that should be feasible.
So, once again - thank you for your great support! 🙂
- Mark as New
- Bookmark
- Subscribe
- Mute
- Subscribe to RSS Feed
- Permalink
- Report Inappropriate Content
Hi @_MoBa_ glad we got it! And sorry it took longer than I expected... 😣
If this is the solution, please go ahead and mark it so others can find help. And let me know if I can help further!
Helpful resources

Microsoft Fabric Learn Together
Covering the world! 9:00-10:30 AM Sydney, 4:00-5:30 PM CET (Paris/Berlin), 7:00-8:30 PM Mexico City

Power BI Monthly Update - April 2024
Check out the April 2024 Power BI update to learn about new features.

| User | Count |
|---|---|
| 113 | |
| 99 | |
| 80 | |
| 70 | |
| 60 |
| User | Count |
|---|---|
| 149 | |
| 114 | |
| 107 | |
| 89 | |
| 67 |


