- Power BI forums
- Updates
- News & Announcements
- Get Help with Power BI
- Desktop
- Service
- Report Server
- Power Query
- Mobile Apps
- Developer
- DAX Commands and Tips
- Custom Visuals Development Discussion
- Health and Life Sciences
- Power BI Spanish forums
- Translated Spanish Desktop
- Power Platform Integration - Better Together!
- Power Platform Integrations (Read-only)
- Power Platform and Dynamics 365 Integrations (Read-only)
- Training and Consulting
- Instructor Led Training
- Dashboard in a Day for Women, by Women
- Galleries
- Community Connections & How-To Videos
- COVID-19 Data Stories Gallery
- Themes Gallery
- Data Stories Gallery
- R Script Showcase
- Webinars and Video Gallery
- Quick Measures Gallery
- 2021 MSBizAppsSummit Gallery
- 2020 MSBizAppsSummit Gallery
- 2019 MSBizAppsSummit Gallery
- Events
- Ideas
- Custom Visuals Ideas
- Issues
- Issues
- Events
- Upcoming Events
- Community Blog
- Power BI Community Blog
- Custom Visuals Community Blog
- Community Support
- Community Accounts & Registration
- Using the Community
- Community Feedback
Register now to learn Fabric in free live sessions led by the best Microsoft experts. From Apr 16 to May 9, in English and Spanish.
- Power BI forums
- Forums
- Get Help with Power BI
- Desktop
- Re: Dynamic dimention values on chart
- Subscribe to RSS Feed
- Mark Topic as New
- Mark Topic as Read
- Float this Topic for Current User
- Bookmark
- Subscribe
- Printer Friendly Page
- Mark as New
- Bookmark
- Subscribe
- Mute
- Subscribe to RSS Feed
- Permalink
- Report Inappropriate Content
Dynamic dimention values on chart
Hello,
I need to put the seller ranking on the chart. However, on the Y axis I would like to display a place in the ranking instead of First Name (it must be hidden), and First Name should be visible only for one selected seller. His position on the chart will change depending on the filters used.
Of course, in practice the problem is much more complex.
Suppose I have 2 tables:
I create the following chart:
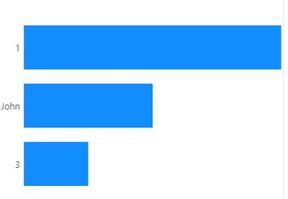
However, I would like 1-John-3 to be displayed instead of names like this:
John can be in any position depending on the filtering.
How to put the values from the ranking on the chart axis (Ranking = RANKX (ALLSELECTED (Table2 [Name]); [Value] ;; asc; Dense))?
I can't create separate tables with rankings for all variants because there is just too much of it.
Please help
- Mark as New
- Bookmark
- Subscribe
- Mute
- Subscribe to RSS Feed
- Permalink
- Report Inappropriate Content
Hello @Lokisame
I have put a sample PBIX here.
One method I can think of involves creating a special dimension table that contains all Names and possible Rank values.
In my sample model I created these tables:
NameRank
(NameRank column is used on the category axis of the chart)
| Rank | Name | NameRank |
| George | George | |
| James | James | |
| John | John | |
| 1 | 1 | |
| 2 | 2 | |
| 3 | 3 |
Name
(to select which names will be displayed rather than ranks)
| Name |
| George |
| James |
| John |
Data
(sample data table you posted)
| Name | Value |
| George | 20 |
| James | 5 |
| John | 10 |
In my sample model these tables are all disconnected.
Then create this measure:
Value by NameRank =
// The selections of 'Name'[Name] will be displayed as Name rather than Rank
VAR SelectedNames =
    VALUES ( 'Name'[Name] )
VAR AllselectedNames =
    CALCULATETABLE ( VALUES ( Data[Name] ), ALLSELECTED () )
VAR NamesWithRanks =
    ADDCOLUMNS(
        AllselectedNames,
        "RankIfRequired",
        IF (
            NOT CONTAINS ( SelectedNames, 'Name'[Name], Data[Name]),
            RANKX ( AllselectedNames, CALCULATE ( SUM ( Data[Value] ) ),,DESC )
        )
    )
RETURN
    SUMX (
        NameRank,
        VAR CurrentName = NameRank[Name]
        VAR CurrentRank = NameRank[Rank]
        RETURN
            CALCULATE (
            	SUM ( Data[Value] ),
            	FILTER (
            		NamesWithRanks,
                    // Display value against name if required
            		ISBLANK( [RankIfRequired] ) && Data[Name] = CurrentName
            		// Or display value against rank if required
                    || [RankIfRequired] = CurrentRank && NOT ISBLANK ( CurrentRank )
            	)
           )
    )
This measure could probably be simplified a bit.
The basic logic is to
- Get a list of selected Names from the Name table. These names are to be displayed as Names not ranks. (SelectedNames)
You could have another method of choosing which Names are to be displayed. - Assign a rank to each Name in the Data table, as long as that name has not been selected above, in which case leave the rank blank. (NamesWithRanks)
- Iterate over the NameRank table and return the desired value either against the row containing the Rank or the Name. I used SUMX so that the total will make sense if displayed - maybe not needed.
Then a visual showing [Value by NameRank] by NameRank[NameRank] should look as intended:
Hopefully that's of some use and can be adapted if needed.
Kind regards,
Owen
- Mark as New
- Bookmark
- Subscribe
- Mute
- Subscribe to RSS Feed
- Permalink
- Report Inappropriate Content
That is not exacly what I had in mind. But thank you very much - that was helpful.
Helpful resources

Microsoft Fabric Learn Together
Covering the world! 9:00-10:30 AM Sydney, 4:00-5:30 PM CET (Paris/Berlin), 7:00-8:30 PM Mexico City

Power BI Monthly Update - April 2024
Check out the April 2024 Power BI update to learn about new features.

| User | Count |
|---|---|
| 111 | |
| 95 | |
| 80 | |
| 68 | |
| 59 |
| User | Count |
|---|---|
| 150 | |
| 119 | |
| 104 | |
| 87 | |
| 67 |


