Register now to learn Fabric in free live sessions led by the best Microsoft experts. From Apr 16 to May 9, in English and Spanish.
Hello,
is this possible to achieve to have columns with values taken from measure which are dynamicaly changed?
I spent several hours without exact output restul that I need.
Let me describe the problem:
I have countries with values comming from different date. I need time slicer and take the highest value for each country for selected period. For now it works only with measure which I cannot use as a Picture link in ChicletSlicer that's why i need to store the result in a column for each country.
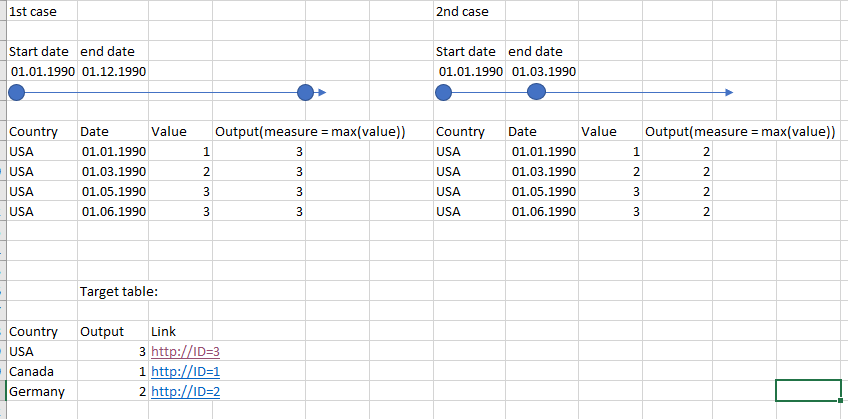
I was able to achieve column which is filled according to measure value but it takes whole range of dates into calculation account:
1. for 1st case from the picture it always returns 3
2. for 2nd case it is also 3
Target is to achieve dynamic column [output] which is calculated based on [values] for selected period of time and according to value from [output] column i need to creat url link in another column.
I hope you guys will help me with this problem
Regards,
Oskar
Solved! Go to Solution.
Hi @Anonymous
In Powre BI, Column doesn't support to change dynamically, only measure can be dynamical,but measure can't be added in a slicer.
What can be achieved is as below:
Create two tables
Sheet5
date | country | value |
1/1/2019 | USA | 1 |
1/3/2019 | USA | 2 |
1/5/2019 | USA | 3 |
1/6/2019 | USA | 3 |
1/1/2019 | Canada | 1 |
1/3/2019 | Canada | 1 |
1/5/2019 | Canada | 1 |
1/6/2019 | Canada | 1 |
1/1/2019 | Germany | 1 |
1/3/2019 | Germany | 1 |
1/5/2019 | Germany | 2 |
1/6/2019 | Germany | 1 |
Sheet6
id | link |
1 | http://ID=1 |
2 | http://ID=2 |
3 | http://ID=3 |
4 | http://ID=4 |
5 | http://ID=5 |
6 | http://ID=6 |
7 | http://ID=7 |
8 | http://ID=8 |
9 | http://ID=9 |
10 | http://ID=10 |
11 | http://ID=11 |
Import two tables to Power BI, don't connect them
Create measures in Sheet5
Measure = CALCULATE(MAX(Sheet5[value]),FILTER(ALLSELECTED(Sheet5),Sheet5[country]=MAX(Sheet5[country]))) Measure 2 = LOOKUPVALUE(Sheet6[link],Sheet6[id],[Measure])
Best Regards
Maggie
Community Support Team _ Maggie Li
If this post helps, then please consider Accept it as the solution to help the other members find it more quickly.
Thank you for your response
Everything good, your solution works perfect but is there any possibility to use result from measure 2 as a column ?
I cannot connect measure to ChicletSlicer
Best regards,
Oskar
Covering the world! 9:00-10:30 AM Sydney, 4:00-5:30 PM CET (Paris/Berlin), 7:00-8:30 PM Mexico City
Check out the April 2024 Power BI update to learn about new features.
User | Count |
---|---|
109 | |
99 | |
77 | |
66 | |
54 |
User | Count |
---|---|
144 | |
104 | |
101 | |
86 | |
64 |