- Power BI forums
- Updates
- News & Announcements
- Get Help with Power BI
- Desktop
- Service
- Report Server
- Power Query
- Mobile Apps
- Developer
- DAX Commands and Tips
- Custom Visuals Development Discussion
- Health and Life Sciences
- Power BI Spanish forums
- Translated Spanish Desktop
- Power Platform Integration - Better Together!
- Power Platform Integrations (Read-only)
- Power Platform and Dynamics 365 Integrations (Read-only)
- Training and Consulting
- Instructor Led Training
- Dashboard in a Day for Women, by Women
- Galleries
- Community Connections & How-To Videos
- COVID-19 Data Stories Gallery
- Themes Gallery
- Data Stories Gallery
- R Script Showcase
- Webinars and Video Gallery
- Quick Measures Gallery
- 2021 MSBizAppsSummit Gallery
- 2020 MSBizAppsSummit Gallery
- 2019 MSBizAppsSummit Gallery
- Events
- Ideas
- Custom Visuals Ideas
- Issues
- Issues
- Events
- Upcoming Events
- Community Blog
- Power BI Community Blog
- Custom Visuals Community Blog
- Community Support
- Community Accounts & Registration
- Using the Community
- Community Feedback
Register now to learn Fabric in free live sessions led by the best Microsoft experts. From Apr 16 to May 9, in English and Spanish.
- Power BI forums
- Forums
- Get Help with Power BI
- Desktop
- Dynamic change of Column Series in stacked column ...
- Subscribe to RSS Feed
- Mark Topic as New
- Mark Topic as Read
- Float this Topic for Current User
- Bookmark
- Subscribe
- Printer Friendly Page
- Mark as New
- Bookmark
- Subscribe
- Mute
- Subscribe to RSS Feed
- Permalink
- Report Inappropriate Content
Dynamic change of Column Series in stacked column chart
I am working on a stacked column chart visual where I want to dynamically change the column series. The column series data I want to use are separate columns. Anyone have any experience or suggestions?
- Mark as New
- Bookmark
- Subscribe
- Mute
- Subscribe to RSS Feed
- Permalink
- Report Inappropriate Content
Can you provide more detail on what your raw data looks like and any relationships? Why is the series in separate columns and what's the trigger for the dynamic change?
This sounds like something that could be done using Calculation Groups or parameters or similar, but not sure with the limited info you've provided so far.
Please @mention me in your reply if you want a response.
Copying DAX from this post? Click here for a hack to quickly replace it with your own table names
Has this post solved your problem? Please Accept as Solution so that others can find it quickly and to let the community know your problem has been solved.
If you found this post helpful, please give Kudos C
I work as a Microsoft trainer and consultant, specialising in Power BI and Power Query.
www.excelwithallison.com
- Mark as New
- Bookmark
- Subscribe
- Mute
- Subscribe to RSS Feed
- Permalink
- Report Inappropriate Content
Hi @AllisonKennedy ,
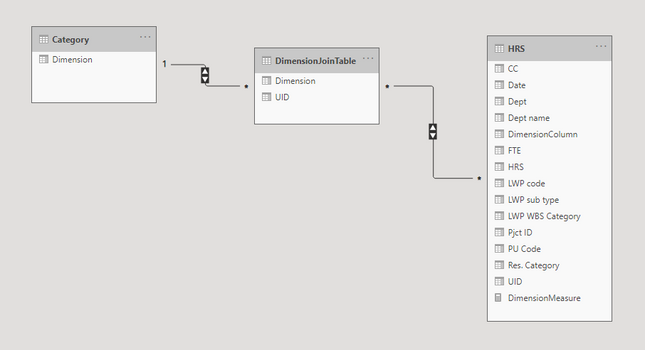
I'm trying to use a slicer for the dynamic change. I've created a Dimension slicer Name "Category" which has a the dimension that I want to show on the graph in the Column series. I've not seen an example where the Column Series is dynamic so I was trying to write a SWITCH measure....but not sure if this even works.

- Mark as New
- Bookmark
- Subscribe
- Mute
- Subscribe to RSS Feed
- Permalink
- Report Inappropriate Content
@IFEDataPerson It looks like you might be missing some values in your dimension table too? There shouldn't be any null/blank values in your dimension slicer.
You definitely want it to have unique values, so need to make sure you can get a truly UID. See Part 2 in this series for a bit of help on combining columns to make that happen if needed: https://excelwithallison.blogspot.com/2020/08/its-complicated-relationships-in-power_92.html
And then, we'll need a peak at your SWITCH measure.
Instead of doing a SWITCH, I'm wondering if you might want to UNPIVOT the columns in Power Query? Then you'll only have one column and it will create an Attribute column for you to use as the slicer.
Please @mention me in your reply if you want a response.
Copying DAX from this post? Click here for a hack to quickly replace it with your own table names
Has this post solved your problem? Please Accept as Solution so that others can find it quickly and to let the community know your problem has been solved.
If you found this post helpful, please give Kudos C
I work as a Microsoft trainer and consultant, specialising in Power BI and Power Query.
www.excelwithallison.com
Helpful resources

Microsoft Fabric Learn Together
Covering the world! 9:00-10:30 AM Sydney, 4:00-5:30 PM CET (Paris/Berlin), 7:00-8:30 PM Mexico City

Power BI Monthly Update - April 2024
Check out the April 2024 Power BI update to learn about new features.

| User | Count |
|---|---|
| 114 | |
| 99 | |
| 82 | |
| 70 | |
| 61 |
| User | Count |
|---|---|
| 149 | |
| 114 | |
| 107 | |
| 89 | |
| 67 |

