- Power BI forums
- Updates
- News & Announcements
- Get Help with Power BI
- Desktop
- Service
- Report Server
- Power Query
- Mobile Apps
- Developer
- DAX Commands and Tips
- Custom Visuals Development Discussion
- Health and Life Sciences
- Power BI Spanish forums
- Translated Spanish Desktop
- Power Platform Integration - Better Together!
- Power Platform Integrations (Read-only)
- Power Platform and Dynamics 365 Integrations (Read-only)
- Training and Consulting
- Instructor Led Training
- Dashboard in a Day for Women, by Women
- Galleries
- Community Connections & How-To Videos
- COVID-19 Data Stories Gallery
- Themes Gallery
- Data Stories Gallery
- R Script Showcase
- Webinars and Video Gallery
- Quick Measures Gallery
- 2021 MSBizAppsSummit Gallery
- 2020 MSBizAppsSummit Gallery
- 2019 MSBizAppsSummit Gallery
- Events
- Ideas
- Custom Visuals Ideas
- Issues
- Issues
- Events
- Upcoming Events
- Community Blog
- Power BI Community Blog
- Custom Visuals Community Blog
- Community Support
- Community Accounts & Registration
- Using the Community
- Community Feedback
Register now to learn Fabric in free live sessions led by the best Microsoft experts. From Apr 16 to May 9, in English and Spanish.
- Power BI forums
- Forums
- Get Help with Power BI
- Desktop
- Dynamic Top Value of column based on Measure
- Subscribe to RSS Feed
- Mark Topic as New
- Mark Topic as Read
- Float this Topic for Current User
- Bookmark
- Subscribe
- Printer Friendly Page
- Mark as New
- Bookmark
- Subscribe
- Mute
- Subscribe to RSS Feed
- Permalink
- Report Inappropriate Content
Dynamic Top Value of column based on Measure
I'm trying to add 2 measure values in Line Chart, both measure values have to show sales. But Measure1 should show value of the Company which has done most sales over a period of time and Measure2 should show second best Company which has done the most sales.
This Company should vary dynamically based on selection and even the label of measures value in line chart should vary dynamically.
Data Used :
| Year | Company | Sales |
| 2019 | CompanyA | 200 |
| 2019 | CompanyB | 500 |
| 2019 | CompanyC | 300 |
| 2019 | CompanyD | 800 |
| 2019 | CompanyE | 900 |
| 2019 | CompanyF | 600 |
| 2020 | CompanyA | 120 |
| 2020 | CompanyB | 50 |
| 2020 | CompanyC | 30 |
| 2020 | CompanyD | 80 |
| 2020 | CompanyE | 90 |
| 2020 | CompanyF | 45 |
Expected Output :
- Mark as New
- Bookmark
- Subscribe
- Mute
- Subscribe to RSS Feed
- Permalink
- Report Inappropriate Content
@Baarathi88
Sorry for misunderstanding, I now see that you want compare the some of the company sales.
You would need a calculate column first:
Sum By Company = CALCULATE(SUM('Table'[Sales]),ALLEXCEPT('Table','Table'[Company]))
Then create two measures:
Measure 1 = CALCULATE(SUM('Table'[Sales]),FILTER('Table',[Sum By Company]=MAX('Table'[Sum By Company])))
Measure 2 = CALCULATE(SUM('Table'[Sales]),FILTER('Table',[Sum By Company] = CALCULATE(MAX([Sum By Company]),FILTER('Table',[Sum By Company]<MAX([Sum By Company])))))
Paul Zheng _ Community Support Team
If this post helps, then please consider Accept it as the solution to help the other members find it more quickly.
- Mark as New
- Bookmark
- Subscribe
- Mute
- Subscribe to RSS Feed
- Permalink
- Report Inappropriate Content
@V-pazhen-msft could you please share the file. The expression throws an error for me
- Mark as New
- Bookmark
- Subscribe
- Mute
- Subscribe to RSS Feed
- Permalink
- Report Inappropriate Content
You should create Sum By Company using Calculate column not a measure.
Paul Zheng _ Community Support Team
If this post helps, then please consider Accept it as the solution to help the other members find it more quickly.
- Mark as New
- Bookmark
- Subscribe
- Mute
- Subscribe to RSS Feed
- Permalink
- Report Inappropriate Content
- Mark as New
- Bookmark
- Subscribe
- Mute
- Subscribe to RSS Feed
- Permalink
- Report Inappropriate Content
- Mark as New
- Bookmark
- Subscribe
- Mute
- Subscribe to RSS Feed
- Permalink
- Report Inappropriate Content
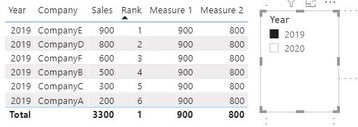
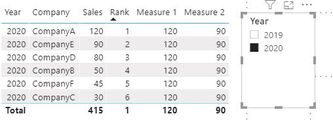
@Baarathi88 , try like
Rank =rankx(all(Table[company]),calculate(sum(table[sales])),,desc,dense)
measure 1 = sumx(filter(values(Table[company]),[Rank]=1),Sum(table[sales]))
measure 2 = sumx(filter(values(Table[company]),[Rank]=2),Sum(table[sales]))
For Rank Refer these links
https://radacad.com/how-to-use-rankx-in-dax-part-2-of-3-calculated-measures
https://radacad.com/how-to-use-rankx-in-dax-part-1-of-3-calculated-columns
https://radacad.com/how-to-use-rankx-in-dax-part-3-of-3-the-finale
https://community.powerbi.com/t5/Community-Blog/Dynamic-TopN-made-easy-with-What-If-Parameter/ba-p/3...
Microsoft Power BI Learning Resources, 2023 !!
Learn Power BI - Full Course with Dec-2022, with Window, Index, Offset, 100+ Topics !!
Did I answer your question? Mark my post as a solution! Appreciate your Kudos !! Proud to be a Super User! !!
- Mark as New
- Bookmark
- Subscribe
- Mute
- Subscribe to RSS Feed
- Permalink
- Report Inappropriate Content
@amitchandak Thank You, but the concern with below expression is
measure 1 = sumx(filter(values(Table[company]),[Rank]=1),Sum(table[sales]))
For Example : In 2019 CompanyA is Rank = 1 and In 2020 CompanyB is Rank 1. Both CompanyA and CompanyB are represented in same line in the line chart.
But ideally, I need Ranking based on summation of sales for entire time period which has been selected.
For example, If Company A sales for 2019 + Company A sales for 2020 is highest. Then measure 1 should values of Company A in 2019 and 2020 in the line chart
Do you have any suggestions for that?
- Mark as New
- Bookmark
- Subscribe
- Mute
- Subscribe to RSS Feed
- Permalink
- Report Inappropriate Content
You need to use allseleted() when you want the measures to be dynamic based on the selection on the slicer.
Rank = RANKX(ALLSELECTED('Table'),CALCULATE(SUM('table'[sales])),,DESC,Dense)

Measure 1 = CALCULATE(SUM('Table'[Sales]),FILTER(ALLSELECTED('Table'),[Rank]=1))
Measure 2 = CALCULATE(SUM('Table'[Sales]),FILTER(ALLSELECTED('Table'),[Rank]=2))
Paul Zheng _ Community Support Team
If this post helps, then please consider Accept it as the solution to help the other members find it more quickly.
- Mark as New
- Bookmark
- Subscribe
- Mute
- Subscribe to RSS Feed
- Permalink
- Report Inappropriate Content
@V-pazhen-msft Thank you for your response. Let me explain the scenario once again.
Measure1 should represent CompanyE (the company with most sales for period of 2019 and 2020 put together)
Measure2 Should represent CompanyD (the company with 2nd most sales for period of 2019 and 2020 put together)
Thus when I create a line chart, Measure1 should represent CompanyE in LineChart . As the per the data the values in line chart should be 900 in 2019 and 90 in 2020
- Mark as New
- Bookmark
- Subscribe
- Mute
- Subscribe to RSS Feed
- Permalink
- Report Inappropriate Content
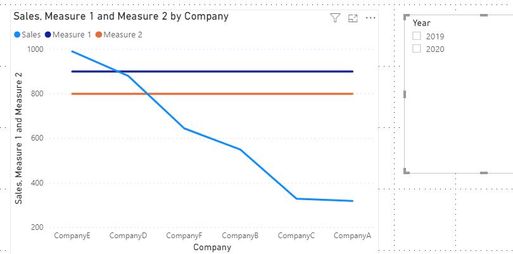
@Baarathi88
Please give it a try, the is the linechart for the measures:
If that's not what you want, please provide your expected line graph with picture.
Paul Zheng _ Community Support Team
If this post helps, then please consider Accept it as the solution to help the other members find it more quickly.
- Mark as New
- Bookmark
- Subscribe
- Mute
- Subscribe to RSS Feed
- Permalink
- Report Inappropriate Content
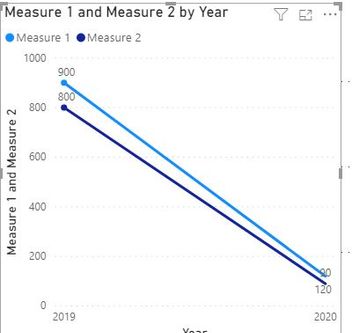
below line chart is the sample output required based on the data i have provided
- Mark as New
- Bookmark
- Subscribe
- Mute
- Subscribe to RSS Feed
- Permalink
- Report Inappropriate Content
For 2020, did you mean 120 for measure1, 90 for measure2. (The max is 120, second high sales is 90).
In this case, you do not need the rank measure, two simple measures should do.
Measure 1 = MAX('Table'[Sales])
Measure 2 = CALCULATE(MAX('Table'[Sales]),FILTER('Table',[Sales]<MAX([Sales])))
Paul Zheng _ Community Support Team
If this post helps, then please consider Accept it as the solution to help the other members find it more quickly.
- Mark as New
- Bookmark
- Subscribe
- Mute
- Subscribe to RSS Feed
- Permalink
- Report Inappropriate Content
@V-pazhen-msft I'm Sorry, Actually this is not the actual solution, In the image that has been shared by you the value 120 is coming in dark blue line, as per my scenario, it should come under light blue line.
Light blue line should have maximum value - maximum value for 2019 is 900 and maximum value for 2020 in 120
According to your logic it is taking summation and determining the maximum which is not the right approach.
Helpful resources

Microsoft Fabric Learn Together
Covering the world! 9:00-10:30 AM Sydney, 4:00-5:30 PM CET (Paris/Berlin), 7:00-8:30 PM Mexico City

Power BI Monthly Update - April 2024
Check out the April 2024 Power BI update to learn about new features.

| User | Count |
|---|---|
| 115 | |
| 100 | |
| 88 | |
| 68 | |
| 61 |
| User | Count |
|---|---|
| 150 | |
| 120 | |
| 100 | |
| 87 | |
| 68 |


