- Power BI forums
- Updates
- News & Announcements
- Get Help with Power BI
- Desktop
- Service
- Report Server
- Power Query
- Mobile Apps
- Developer
- DAX Commands and Tips
- Custom Visuals Development Discussion
- Health and Life Sciences
- Power BI Spanish forums
- Translated Spanish Desktop
- Power Platform Integration - Better Together!
- Power Platform Integrations (Read-only)
- Power Platform and Dynamics 365 Integrations (Read-only)
- Training and Consulting
- Instructor Led Training
- Dashboard in a Day for Women, by Women
- Galleries
- Community Connections & How-To Videos
- COVID-19 Data Stories Gallery
- Themes Gallery
- Data Stories Gallery
- R Script Showcase
- Webinars and Video Gallery
- Quick Measures Gallery
- 2021 MSBizAppsSummit Gallery
- 2020 MSBizAppsSummit Gallery
- 2019 MSBizAppsSummit Gallery
- Events
- Ideas
- Custom Visuals Ideas
- Issues
- Issues
- Events
- Upcoming Events
- Community Blog
- Power BI Community Blog
- Custom Visuals Community Blog
- Community Support
- Community Accounts & Registration
- Using the Community
- Community Feedback
Register now to learn Fabric in free live sessions led by the best Microsoft experts. From Apr 16 to May 9, in English and Spanish.
- Power BI forums
- Forums
- Get Help with Power BI
- Desktop
- Re: Divide sum by group on average by group
- Subscribe to RSS Feed
- Mark Topic as New
- Mark Topic as Read
- Float this Topic for Current User
- Bookmark
- Subscribe
- Printer Friendly Page
- Mark as New
- Bookmark
- Subscribe
- Mute
- Subscribe to RSS Feed
- Permalink
- Report Inappropriate Content
Divide sum by group on average by group
Hi!
I have a dataset like this:
| id | Order | Sold |
| 1 | 1400 | 700 |
| 1 | 1400 | 500 |
| 1 | 1400 | 150 |
| 2 | 1500 | 600 |
| 2 | 1500 | 600 |
| 2 | 1500 | 300 |
I want calculated deliver% by calculate the sum of number of sold by id and then divide on the number of order of that id. Because the order is equal for each row of the id i tried to use the average of order by id. So i created three measures like this:
NSold= CALCULATE(SUM(Table[Sold]), Table[Id])
NOrder= CALCULATE(AVERAGE(Table[Order]), Table[Id])
Deliver%=DIVIDE([NSold], [NOrder])*100
However, I don't get any number for all the three measures. Would it be a problem if the id is missing in som colums? Do anyone have another solution on how to do this?
Regard Marit
Solved! Go to Solution.
- Mark as New
- Bookmark
- Subscribe
- Mute
- Subscribe to RSS Feed
- Permalink
- Report Inappropriate Content
Hi @Marit ,
Could you pls provide some sample data which has date in it with expected output?
Best Regards,
Kelly
Did I answer your question? Mark my post as a solution!
- Mark as New
- Bookmark
- Subscribe
- Mute
- Subscribe to RSS Feed
- Permalink
- Report Inappropriate Content
Hi @Marit ,
Try this measure:
_Delivery % = DIVIDE(SUM('Table'[Sold]), AVERAGE('Table'[Order]), 0) * 100

- Mark as New
- Bookmark
- Subscribe
- Mute
- Subscribe to RSS Feed
- Permalink
- Report Inappropriate Content
Thank you for your suggestion. I don't get one row for each id by doing this. I think I have to specify that i should by one for each id in someway.
Regards Marit
- Mark as New
- Bookmark
- Subscribe
- Mute
- Subscribe to RSS Feed
- Permalink
- Report Inappropriate Content
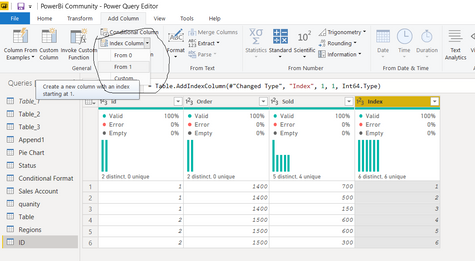
@Marit You will have to create a index column in your data to be able to view data by each row. You can add index column in powequery window like below.
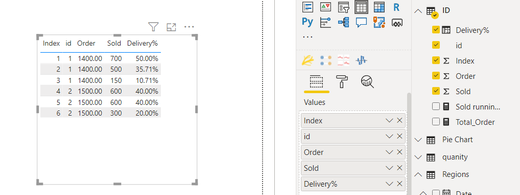
Once added, you can then create below visual
Did I answer your question? Mark my post as a solution!
Appreciate your Kudos
Proud to be a Super User!
Follow me on linkedin
- Mark as New
- Bookmark
- Subscribe
- Mute
- Subscribe to RSS Feed
- Permalink
- Report Inappropriate Content
Thank for your help!
I do not want to the delivery% per row in my data, I want to it per id. And then show the average per date in a visual.
This meassure give med the right precentage in a table with id in the first coloumn:
But I can't use this meassure to get the average of these percentage by date in vissual.
- Mark as New
- Bookmark
- Subscribe
- Mute
- Subscribe to RSS Feed
- Permalink
- Report Inappropriate Content
Hi @Marit ,
Could you pls provide some sample data which has date in it with expected output?
Best Regards,
Kelly
Did I answer your question? Mark my post as a solution!
Helpful resources

Microsoft Fabric Learn Together
Covering the world! 9:00-10:30 AM Sydney, 4:00-5:30 PM CET (Paris/Berlin), 7:00-8:30 PM Mexico City

Power BI Monthly Update - April 2024
Check out the April 2024 Power BI update to learn about new features.

| User | Count |
|---|---|
| 114 | |
| 100 | |
| 78 | |
| 75 | |
| 50 |
| User | Count |
|---|---|
| 144 | |
| 109 | |
| 108 | |
| 87 | |
| 61 |


