- Power BI forums
- Updates
- News & Announcements
- Get Help with Power BI
- Desktop
- Service
- Report Server
- Power Query
- Mobile Apps
- Developer
- DAX Commands and Tips
- Custom Visuals Development Discussion
- Health and Life Sciences
- Power BI Spanish forums
- Translated Spanish Desktop
- Power Platform Integration - Better Together!
- Power Platform Integrations (Read-only)
- Power Platform and Dynamics 365 Integrations (Read-only)
- Training and Consulting
- Instructor Led Training
- Dashboard in a Day for Women, by Women
- Galleries
- Community Connections & How-To Videos
- COVID-19 Data Stories Gallery
- Themes Gallery
- Data Stories Gallery
- R Script Showcase
- Webinars and Video Gallery
- Quick Measures Gallery
- 2021 MSBizAppsSummit Gallery
- 2020 MSBizAppsSummit Gallery
- 2019 MSBizAppsSummit Gallery
- Events
- Ideas
- Custom Visuals Ideas
- Issues
- Issues
- Events
- Upcoming Events
- Community Blog
- Power BI Community Blog
- Custom Visuals Community Blog
- Community Support
- Community Accounts & Registration
- Using the Community
- Community Feedback
Register now to learn Fabric in free live sessions led by the best Microsoft experts. From Apr 16 to May 9, in English and Spanish.
- Power BI forums
- Forums
- Get Help with Power BI
- Desktop
- Display last N months and previous months in the c...
- Subscribe to RSS Feed
- Mark Topic as New
- Mark Topic as Read
- Float this Topic for Current User
- Bookmark
- Subscribe
- Printer Friendly Page
- Mark as New
- Bookmark
- Subscribe
- Mute
- Subscribe to RSS Feed
- Permalink
- Report Inappropriate Content
Display last N months and previous months in the corresponding month
Hi,
I have a date table connected to a fact table. I was able to create a what-if parameter that I can adjust to display how many periods of data I want to display in a line chart and table (I followed SQLjason's guide here Display Last N Months & Selected Month using Single Date Dimension in Power BI – Some Random Thought...
I am able to display each months data using this measure:
Sales (last n months) =
CALCULATE (
    SUM ( Sales[Sales] ),
    DATESINPERIOD ( ‘Date'[Date], MAX ( ‘Date'[Date] ), – [N Value], MONTH )
)
Usually, I am able to display last month's data in the corresponding current period by just using the parallelperiod function like this:
Sales last period =
CALCULATE (
     [Sales (last n months)] ,
     PARALLELPERIOD (
          'Date'[Date] ,
          -1 ,
          MONTH
     )
)
However, when I use this measure, assuming I selected N = 5 periods, I get this table:
+-----------------+---------+---------+---------+---------+---------+
|                 | Jan     | Feb     | Mar     | Apr     | May     |
|                 | 2021    | 2021    | 2020    | 2020    | 2020    |
+-----------------+---------+---------+---------+---------+---------+
| Sales           | 202,101 | 202,102 | 202,103 | 202,104 | 202,105 |
| (last n months) |         |         |         |         |         |
+-----------------+---------+---------+---------+---------+---------+
| Sales           | 202,101 | 202,102 | 202,103 | 202,104 |         |
| last month      |         |         |         |         |         |
+-----------------+---------+---------+---------+---------+---------+
Instead of this table
+-----------------+---------+---------+---------+---------+---------+
|                 | Jan     | Feb     | Mar     | Apr     | May     |
|                 | 2021    | 2021    | 2020    | 2020    | 2020    |
+-----------------+---------+---------+---------+---------+---------+
| Sales           | 202,101 | 202,102 | 202,103 | 202,104 | 202,105 |
| (last n months) |         |         |         |         |         |
+-----------------+---------+---------+---------+---------+---------+
| Sales           |         | 202,101 | 202,102 | 202,103 | 202,104 |
| last month      |         |         |         |         |         |
+-----------------+---------+---------+---------+---------+---------+
Thank you.
Solved! Go to Solution.
- Mark as New
- Bookmark
- Subscribe
- Mute
- Subscribe to RSS Feed
- Permalink
- Report Inappropriate Content
Hi @stochasticKL ,
I created the data:
Date Table:
Sale Table:
Here are the steps you can follow:
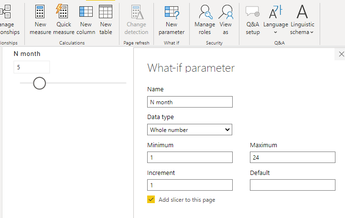
1. Use what if parameter to create N month
2. Create meausre.
This month = SUM('Table'[amount])Last month =
SUMX(FILTER(ALL('Table'),MONTH([date])=MONTH(MAX('Table'[date]))-1),[amount])Flag =
IF(
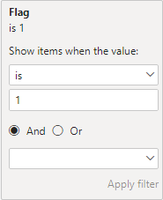
MONTH(MAX('Date'[Date]))>=MONTH(TODAY())-[N month Value]&&MONTH(MAX('Date'[Date]))<=MONTH(TODAY()),1,0)3. Put Flag into Filter, set is =1, and apply filter.
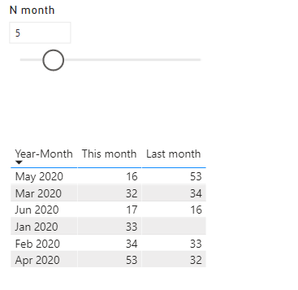
4. Result.
Best Regards,
Liu Yang
If this post helps, then please consider Accept it as the solution to help the other members find it more quickly.
- Mark as New
- Bookmark
- Subscribe
- Mute
- Subscribe to RSS Feed
- Permalink
- Report Inappropriate Content
@stochasticKL , Try a measure like
Sales Last period =
CALCULATE (
SUM ( Sales[Sales] ),
DATESINPERIOD ( 'Date'[Date], MAXX ( 'Date' , dateadd('Date'[Date],-1,month) ), – [N Value], MONTH )
)
Microsoft Power BI Learning Resources, 2023 !!
Learn Power BI - Full Course with Dec-2022, with Window, Index, Offset, 100+ Topics !!
Did I answer your question? Mark my post as a solution! Appreciate your Kudos !! Proud to be a Super User! !!
- Mark as New
- Bookmark
- Subscribe
- Mute
- Subscribe to RSS Feed
- Permalink
- Report Inappropriate Content
Hi @amitchandak! Thank you for your answer. It's doing what you said - n months last year. Which shows something like this:
+-----------------+------+------+------+------+------+------+------+------+------+------+
|                 | Jan  | Feb  | Mar  | Apr  | May  | Jan  | Feb  | Mar  | Apr  | May  |
|                 | 2020 | 2020 | 2020 | 2020 | 2020 | 2021 | 2021 | 2020 | 2020 | 2020 |
+-----------------+------+------+------+------+------+------+------+------+------+------+
| Sales           |      |      |      |      |      | 1    | 2    | 3    | 4    | 5    |
| (last n months) |      |      |      |      |      |      |      |      |      |      |
+-----------------+------+------+------+------+------+------+------+------+------+------+
| Sales           | x    | x    | x    | x    | x    |      |      |      |      |      |
| last month      |      |      |      |      |      |      |      |      |      |      |
+-----------------+------+------+------+------+------+------+------+------+------+------+
Unfortunately what I would like to do is simply return the last month's value in the current month like this:
+-----------------+------+-----------+-----------+-----------+-----------+
|                 | Jan  | Feb       | Mar       | Apr       | May       |
|                 | 2021 | 2021      | 2020      | 2020      | 2020      |
+-----------------+------+-----------+-----------+-----------+-----------+
| Sales           | 1    | 2         | 3         | 4         | 5         |
| (last n months) |      |           |           |           |           |
+-----------------+------+-----------+-----------+-----------+-----------+
| Sales           |      | 1         | 2         | 3         | 4         |
| last month      |      | (Jan 2021 | (Feb 2021 | (Mar 2021 | (Apr 2021 |
|                 |      | value)    | value)    | value)    | value)    |
+-----------------+------+-----------+-----------+-----------+-----------+
Sorry to have confused you with the terms period and month. Can you please provide another solution?
Thank you!
Helpful resources

Microsoft Fabric Learn Together
Covering the world! 9:00-10:30 AM Sydney, 4:00-5:30 PM CET (Paris/Berlin), 7:00-8:30 PM Mexico City

Power BI Monthly Update - April 2024
Check out the April 2024 Power BI update to learn about new features.

| User | Count |
|---|---|
| 110 | |
| 95 | |
| 76 | |
| 65 | |
| 51 |
| User | Count |
|---|---|
| 146 | |
| 109 | |
| 106 | |
| 88 | |
| 61 |


