- Power BI forums
- Updates
- News & Announcements
- Get Help with Power BI
- Desktop
- Service
- Report Server
- Power Query
- Mobile Apps
- Developer
- DAX Commands and Tips
- Custom Visuals Development Discussion
- Health and Life Sciences
- Power BI Spanish forums
- Translated Spanish Desktop
- Power Platform Integration - Better Together!
- Power Platform Integrations (Read-only)
- Power Platform and Dynamics 365 Integrations (Read-only)
- Training and Consulting
- Instructor Led Training
- Dashboard in a Day for Women, by Women
- Galleries
- Community Connections & How-To Videos
- COVID-19 Data Stories Gallery
- Themes Gallery
- Data Stories Gallery
- R Script Showcase
- Webinars and Video Gallery
- Quick Measures Gallery
- 2021 MSBizAppsSummit Gallery
- 2020 MSBizAppsSummit Gallery
- 2019 MSBizAppsSummit Gallery
- Events
- Ideas
- Custom Visuals Ideas
- Issues
- Issues
- Events
- Upcoming Events
- Community Blog
- Power BI Community Blog
- Custom Visuals Community Blog
- Community Support
- Community Accounts & Registration
- Using the Community
- Community Feedback
Register now to learn Fabric in free live sessions led by the best Microsoft experts. From Apr 16 to May 9, in English and Spanish.
- Power BI forums
- Forums
- Get Help with Power BI
- Desktop
- Re: Disconnected slicer isnt working
- Subscribe to RSS Feed
- Mark Topic as New
- Mark Topic as Read
- Float this Topic for Current User
- Bookmark
- Subscribe
- Printer Friendly Page
- Mark as New
- Bookmark
- Subscribe
- Mute
- Subscribe to RSS Feed
- Permalink
- Report Inappropriate Content
Disconnected slicer isnt working
Hi,
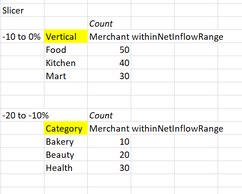
I am trying to create an output where based on the selection of "NetInflowRange", the respective count of Merchants falling within the range will populate. The other dimension (highlighted in yellow) in the matrix output is variable and I presume it can work based on the relationships of the table.
Here is an idea of the expected output but the formula in tab "Qn3" isnt working. Reference formula below too. Hope someone can advise who to make this output work. Thanks!
Here is a sample file: https://www.dropbox.com/scl/fi/rsoy72ni9hwdf99verz3o/exemplify.xlsx?dl=0&rlkey=a1m22k2cif4ej8shlimih...
Formula used:
MexOulets within NetInflowRange =
CALCULATE([MexBrandsWithSale],
    FILTER('d_merchant',[Net Inflow %GMV] >= [Selected Inflow%_Low] &&
        [Net Inflow %GMV] < [Selected Inflow%_Low]))
where
Selected Inflow%_High = MAX('Net Inflow Range'[Low])Selected Inflow%_Low = min('Net Inflow Range'[Low])
- Mark as New
- Bookmark
- Subscribe
- Mute
- Subscribe to RSS Feed
- Permalink
- Report Inappropriate Content
Hi @GraceTCL ,
Really can't understand your expected output based on your sample data and description. Would you please explain more about your expected output?
If this post helps, then please consider Accept it as the solution to help the other members find it more quickly.
Best Regards,
Dedmon Dai
- Mark as New
- Bookmark
- Subscribe
- Mute
- Subscribe to RSS Feed
- Permalink
- Report Inappropriate Content
Hi @v-deddai1-msft ,
I am expecting the count of merchants to be reflected based on the segment (between low and high segmented inflow) that is selected. At the same time, because I will be pulling another dimension eg vertical or category, the count of merchants will be reflected against this other dimension as per table in earlier message. Hope this clarifies!
- Mark as New
- Bookmark
- Subscribe
- Mute
- Subscribe to RSS Feed
- Permalink
- Report Inappropriate Content
Hi @GraceTCL ,
Sorry, I still can't understand your issue. >> Here is an idea of the expected output but the formula in tab "Qn3" isnt working.
What did qn3 mean? If can understand your request, I may be able to give you a solution. Unfortunately, I can't even relate your formula to the sample data you gave us.
Best Regards,
Dedmon Dai
- Mark as New
- Bookmark
- Subscribe
- Mute
- Subscribe to RSS Feed
- Permalink
- Report Inappropriate Content
Hi,
I think i can solve this, but I do not see any semblence between the data that you have shared in the screenshots of your original post and the excel file that you have uploaded. Share a small datasset and on that small sample dataset, show the expected result.
Regards,
Ashish Mathur
http://www.ashishmathur.com
https://www.linkedin.com/in/excelenthusiasts/
Helpful resources

Microsoft Fabric Learn Together
Covering the world! 9:00-10:30 AM Sydney, 4:00-5:30 PM CET (Paris/Berlin), 7:00-8:30 PM Mexico City

Power BI Monthly Update - April 2024
Check out the April 2024 Power BI update to learn about new features.

| User | Count |
|---|---|
| 111 | |
| 95 | |
| 77 | |
| 68 | |
| 54 |
| User | Count |
|---|---|
| 144 | |
| 105 | |
| 102 | |
| 89 | |
| 63 |

