- Power BI forums
- Updates
- News & Announcements
- Get Help with Power BI
- Desktop
- Service
- Report Server
- Power Query
- Mobile Apps
- Developer
- DAX Commands and Tips
- Custom Visuals Development Discussion
- Health and Life Sciences
- Power BI Spanish forums
- Translated Spanish Desktop
- Power Platform Integration - Better Together!
- Power Platform Integrations (Read-only)
- Power Platform and Dynamics 365 Integrations (Read-only)
- Training and Consulting
- Instructor Led Training
- Dashboard in a Day for Women, by Women
- Galleries
- Community Connections & How-To Videos
- COVID-19 Data Stories Gallery
- Themes Gallery
- Data Stories Gallery
- R Script Showcase
- Webinars and Video Gallery
- Quick Measures Gallery
- 2021 MSBizAppsSummit Gallery
- 2020 MSBizAppsSummit Gallery
- 2019 MSBizAppsSummit Gallery
- Events
- Ideas
- Custom Visuals Ideas
- Issues
- Issues
- Events
- Upcoming Events
- Community Blog
- Power BI Community Blog
- Custom Visuals Community Blog
- Community Support
- Community Accounts & Registration
- Using the Community
- Community Feedback
Register now to learn Fabric in free live sessions led by the best Microsoft experts. From Apr 16 to May 9, in English and Spanish.
- Power BI forums
- Forums
- Get Help with Power BI
- Desktop
- Re: Direct Query Azure SQL Speed Problems
- Subscribe to RSS Feed
- Mark Topic as New
- Mark Topic as Read
- Float this Topic for Current User
- Bookmark
- Subscribe
- Printer Friendly Page
- Mark as New
- Bookmark
- Subscribe
- Mute
- Subscribe to RSS Feed
- Permalink
- Report Inappropriate Content
Direct Query Azure SQL Speed Problems
I am having some performance issues with Power BI, both Desktop and Premium with Azure SQL Direct Query. I think it is related to inefficient queries being generated by PBI in some cases.
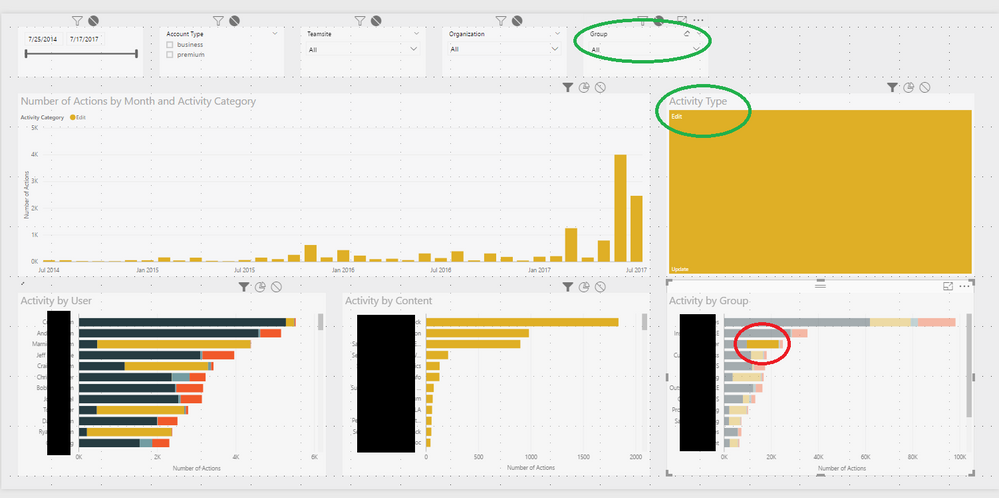
One example: I am working on the dash pictured:
Using direct query against Azure SQL I can filter using the “Group” slicer and the “Activity Type” Treemap and get the results back in under a second (circled in green). However, when I select what I think is the same filter using the “Activity by Group” stacked bar chart, the query will take 90+ seconds to update “Activity by User” (circled in red). These are actually the exact same query!
This doesn’t seem to be a cache problem – I can try different filters in different orders and get consistent results – applying the two filters separately gives me 100x or so speedup over clicking the same filter with the bar chart.
It might help to know that the data relationship looks like this:
Groups (*:1) Users (1:*) Activity
All both directions, with referential integrity. The query I am talking about uses “groups” and “activity” to filter “users”. When I apply the filters separately it is just two easy inner joins – there is no reason the bar chart should take so long.
What is the best way for me to get help about this?
- Mark as New
- Bookmark
- Subscribe
- Mute
- Subscribe to RSS Feed
- Permalink
- Report Inappropriate Content
Hi @cjemmott,
According to your description above, I have tested it with the latest version of Power BI Desktop(2.48.4792.721 64-bit (July 2017)). And I cannot reproduce this issue on my environment.
I would suggest you try creating a support ticket on Power BI Support page for better assistance on this issue. ![]()
Regards
- Mark as New
- Bookmark
- Subscribe
- Mute
- Subscribe to RSS Feed
- Permalink
- Report Inappropriate Content
I opened a support ticket. Here is some additional information:
I ran the same query multiple times from PBI desktop, clicking “refresh” in between to clear the cache. Timing for the long query on two of those were 33 and 26 seconds as viewed from Power BI. Average time from Azure SQL Query Performance Insight was 17 seconds.
This SQL database is using a pool with 800 eDTU and was the only thing running. Multiple tables are joined, the smallest of which has 50 rows and 8 columns, and the largest 50k rows and 12 columns. This seems like it should be very fast!
But somehow the query is 1972 lines long! It basically enumerates every possible case…
I did the same exact query (well, full outer joins rather than relationships with referential integrity) from Tableau. Same database, computer, etc. Tableau used 12 lines of SQL, 2.31 second total query + render with no cache.
Helpful resources

Microsoft Fabric Learn Together
Covering the world! 9:00-10:30 AM Sydney, 4:00-5:30 PM CET (Paris/Berlin), 7:00-8:30 PM Mexico City

Power BI Monthly Update - April 2024
Check out the April 2024 Power BI update to learn about new features.

| User | Count |
|---|---|
| 111 | |
| 100 | |
| 80 | |
| 64 | |
| 58 |
| User | Count |
|---|---|
| 146 | |
| 110 | |
| 93 | |
| 84 | |
| 67 |

