- Power BI forums
- Updates
- News & Announcements
- Get Help with Power BI
- Desktop
- Service
- Report Server
- Power Query
- Mobile Apps
- Developer
- DAX Commands and Tips
- Custom Visuals Development Discussion
- Health and Life Sciences
- Power BI Spanish forums
- Translated Spanish Desktop
- Power Platform Integration - Better Together!
- Power Platform Integrations (Read-only)
- Power Platform and Dynamics 365 Integrations (Read-only)
- Training and Consulting
- Instructor Led Training
- Dashboard in a Day for Women, by Women
- Galleries
- Community Connections & How-To Videos
- COVID-19 Data Stories Gallery
- Themes Gallery
- Data Stories Gallery
- R Script Showcase
- Webinars and Video Gallery
- Quick Measures Gallery
- 2021 MSBizAppsSummit Gallery
- 2020 MSBizAppsSummit Gallery
- 2019 MSBizAppsSummit Gallery
- Events
- Ideas
- Custom Visuals Ideas
- Issues
- Issues
- Events
- Upcoming Events
- Community Blog
- Power BI Community Blog
- Custom Visuals Community Blog
- Community Support
- Community Accounts & Registration
- Using the Community
- Community Feedback
Register now to learn Fabric in free live sessions led by the best Microsoft experts. From Apr 16 to May 9, in English and Spanish.
- Power BI forums
- Forums
- Get Help with Power BI
- Desktop
- Difficulty with relationships creation
- Subscribe to RSS Feed
- Mark Topic as New
- Mark Topic as Read
- Float this Topic for Current User
- Bookmark
- Subscribe
- Printer Friendly Page
- Mark as New
- Bookmark
- Subscribe
- Mute
- Subscribe to RSS Feed
- Permalink
- Report Inappropriate Content
Difficulty with relationships creation
Hello friends,
I have a difficulty creating relationships in Power BI. I thought I created them properly, but when I create visualizations i clearly understand smth is wrong.
I will greatly appreciate if someone may give me an idea where I am wrong.
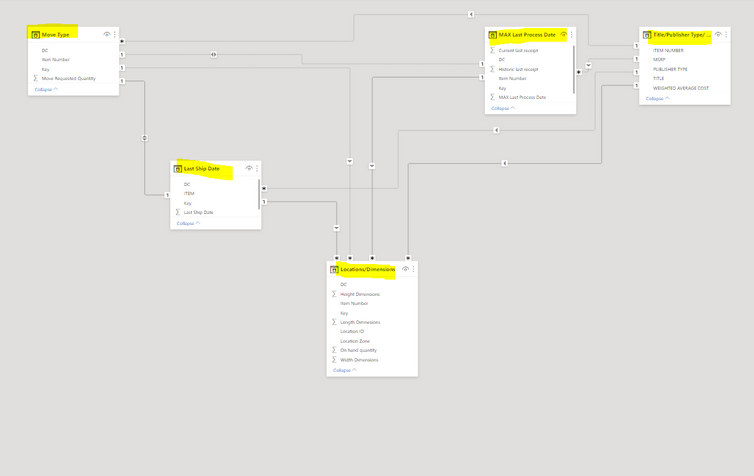
I have 5 tables:
1. Last Ship Date - unique list of outbound itme and last ship date. (unique key)
2. Locations/Dimensions - locations and list of items in them (key is not unique, some key values are repeated)
3. Move Type - is in a sense a central table. It is a list of items that need to be moved. Unique key.
4. MAX Last Process Date -list of items and date when it was last processed. Unique key.
5. Title/Publisher/WAC/MSRP - Just a list of items with their description. Only table where i don't have a key. It is just a description of what the item is about. No measures, calculations nothing here.
Can someone (who has more experience) in Power BI let me know if I connected smth not properly?
All the tables (with the exception on Title/Publisher/Type are connected on key. Title/Publisher/Type connected to all others on Item field.
- Mark as New
- Bookmark
- Subscribe
- Mute
- Subscribe to RSS Feed
- Permalink
- Report Inappropriate Content
Hi @DIFF1
In Power BI, relationships don't always need to be created on the Key columns. They can also be created on other columns. And you have several inactive relationships (dotted lines) in your model. These inactive relationships will not work when you drag columns directly into visuals. Only active relationship (solid lines) will be used to filter data according to their cross-filter directions. To use an inactive relationship, you need to use USERELATIONSHIP function in DAX expressions to activate an inactive relationship.
When you understand something is wrong, it is probably because the active relationship is not chosen or set up correctly. Which column are used in the visual? What is the active relationship between the two tables they are from? Are the columns in the relationship correct that you hope to lookup values based on these columns? When columns are correct, check the cross-filter directions. If tableA should filter tableB, it must have a relationship whose cross-filter direction points to tableB.
As there could only be one active relationship between two tables, if you want to use two relationships at the same time, you could use USERELATIONSHIP to create a measure to get the result.
These articles may be helpful:
Beginner’s Guide to Relationships in Power BI – Curbal
Create and manage relationships in Power BI Desktop - Power BI | Microsoft Docs
Model relationships in Power BI Desktop - Power BI | Microsoft Docs
Best Regards,
Community Support Team _ Jing
If this post helps, please Accept it as Solution to help other members find it.
- Mark as New
- Bookmark
- Subscribe
- Mute
- Subscribe to RSS Feed
- Permalink
- Report Inappropriate Content
Maybe someone knows?
Helpful resources

Microsoft Fabric Learn Together
Covering the world! 9:00-10:30 AM Sydney, 4:00-5:30 PM CET (Paris/Berlin), 7:00-8:30 PM Mexico City

Power BI Monthly Update - April 2024
Check out the April 2024 Power BI update to learn about new features.

| User | Count |
|---|---|
| 111 | |
| 100 | |
| 80 | |
| 64 | |
| 58 |
| User | Count |
|---|---|
| 148 | |
| 111 | |
| 93 | |
| 84 | |
| 66 |

