- Power BI forums
- Updates
- News & Announcements
- Get Help with Power BI
- Desktop
- Service
- Report Server
- Power Query
- Mobile Apps
- Developer
- DAX Commands and Tips
- Custom Visuals Development Discussion
- Health and Life Sciences
- Power BI Spanish forums
- Translated Spanish Desktop
- Power Platform Integration - Better Together!
- Power Platform Integrations (Read-only)
- Power Platform and Dynamics 365 Integrations (Read-only)
- Training and Consulting
- Instructor Led Training
- Dashboard in a Day for Women, by Women
- Galleries
- Community Connections & How-To Videos
- COVID-19 Data Stories Gallery
- Themes Gallery
- Data Stories Gallery
- R Script Showcase
- Webinars and Video Gallery
- Quick Measures Gallery
- 2021 MSBizAppsSummit Gallery
- 2020 MSBizAppsSummit Gallery
- 2019 MSBizAppsSummit Gallery
- Events
- Ideas
- Custom Visuals Ideas
- Issues
- Issues
- Events
- Upcoming Events
- Community Blog
- Power BI Community Blog
- Custom Visuals Community Blog
- Community Support
- Community Accounts & Registration
- Using the Community
- Community Feedback
Register now to learn Fabric in free live sessions led by the best Microsoft experts. From Apr 16 to May 9, in English and Spanish.
- Power BI forums
- Forums
- Get Help with Power BI
- Desktop
- Default Selection for Latest Period (Data for Late...
- Subscribe to RSS Feed
- Mark Topic as New
- Mark Topic as Read
- Float this Topic for Current User
- Bookmark
- Subscribe
- Printer Friendly Page
- Mark as New
- Bookmark
- Subscribe
- Mute
- Subscribe to RSS Feed
- Permalink
- Report Inappropriate Content
Default Selection for Latest Period (Data for Latest Period)
Hi Community,
Need your help.
Sceanrio: I have 2 slicers in one page. Year (YYYY) and Month (YYYYMM).
1) When I open the the dashboard, the slicer has to set for the latest Year and latest Month. i.e the data in all charts should be filtred for this.
2) If I select any Year, then it should filter for the latest/max Month in that Year, and all charts should filtered for this.
3) If I select any Month, then it should show the related month data only across the charts.
Sample Data: below are the 2 slicers.
Year: 2021, 2020, 2019
Months: 202103, 202102, 202101, 202012, 202011,...,202001,201912,201911,...,201901
Expectation:
1) by default the charts should showcase 202103 data (it should be dynamic)
2) if I select 2020, it should showcase data for the month of 202012.
3) if I select 201910, it should showcase data for the month of 201910
I googled for this, but couldn't get it. Appreciate your help. Thank in advance.
Regards
Pradeep
Solved! Go to Solution.
- Mark as New
- Bookmark
- Subscribe
- Mute
- Subscribe to RSS Feed
- Permalink
- Report Inappropriate Content
@v-yangliu-msft thanks for your help.
- Mark as New
- Bookmark
- Subscribe
- Mute
- Subscribe to RSS Feed
- Permalink
- Report Inappropriate Content
Hi @pradeept ,
Here are the steps you can follow:
1. Create a table of two slicers
Slicer1 = SUMMARIZE('Table',[Year])Slicer2 = SUMMARIZE('Table',[Month])2. Create measure.
Flag =
var _selectyear=HASONEVALUE('Slicer1'[Year])
var _selectmonth=HASONEVALUE('Slicer2'[Month])
return
SWITCH(
    TRUE(),
_selectyear=FALSE()&&_selectmonth=FALSE(),IF(MONTH(MAX('Table'[date]))=4&&YEAR(MAX('Table'[date]))=2021,1,0),
_selectyear=FALSE(),IF(MAX('Table'[Month])=SELECTEDVALUE(Slicer2[Month]),1,0),
_selectmonth=FALSE(),IF(SELECTEDVALUE(Slicer1[Year])=2020,IF(MAX('Table'[Month])=202012,1,0),IF(MAX('Table'[Month])=20214,1,0)),
IF(MAX('Table'[Month])=SELECTEDVALUE(Slicer2[Month]),1,0)
)
3. Place the measure in the Filter, select is =1, Apply filter.
4. Result.
When 2021 is selected or not, the following is displayed:
When 2020 is selected, the result shows:
Best Regards,
Liu Yang
If this post helps, then please consider Accept it as the solution to help the other members find it more quickly.
- Mark as New
- Bookmark
- Subscribe
- Mute
- Subscribe to RSS Feed
- Permalink
- Report Inappropriate Content
@v-yangliu-msft thanks for your help.
- Mark as New
- Bookmark
- Subscribe
- Mute
- Subscribe to RSS Feed
- Permalink
- Report Inappropriate Content
Thanks for your responses.
just an update to my requirement, no need to make the default selection in the slicer.
If the charts/tables reflects the 'Max reporting period, that's sufficient.
I used the below DAX for measure calculation.
SalesAmount =
VAR _MaxReportPeriod = MAX(Sales[ReportingPeriod])
RETURN
CALCULATE
(
SUM(Sales[Amount]),Sales[ReportingPeriod] = _MaxReportPeriod
)
I am getting the 'max reporting period' and 'measure' as expected and tested in Table/KPI cards; results are as expected.
Problem:
When I used the measure along with any other dimensions (in my example customer), getting the wrong results. Showing all the customers, even they did not purchase anything in that period.
Expected:
1) When I select 2021 or did not select anything...
The max reporting period is 202104. During 202104, the customers C1,C2,C3 only did the purchase. So the Chart/table should show C1,C2,C3 only; should not show C4,C5,C6.
2) When I select 2020
The max reporting period is 202012. During 202012, the customers C1,C2,C4,C6 only did the purchase. So the Chart/table should show C1,C2,C4,C6 only; should not show C3,C5.
Similar to 'Customer', there are couple of other dimensions.. (Country,Product, Age Group..). So looking for generic solution.
Thanks in advance.
- Mark as New
- Bookmark
- Subscribe
- Mute
- Subscribe to RSS Feed
- Permalink
- Report Inappropriate Content
Hi @pradeept ,
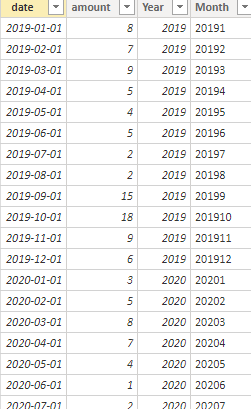
According to your description, I create some data:
Here are the steps you can follow:
1. Create calculated Table.
Slicer = SUMMARIZE('Table',[Year])
2. Create measure.
Flag =
var _selectyear=HASONEVALUE('Slicer'[Year])
var _selectmonth=HASONEVALUE('Table'[Month])
return
SWITCH(
    TRUE(),  _selectyear=FALSE()&&_selectmonth=FALSE(),CALCULATE(SUM('Table'[amount]),FILTER(ALL('Table'),MONTH('Table'[date])=3&&YEAR('Table'[date])=2021)),
_selectyear=FALSE(),SUM('Table'[amount]),
_selectmonth=FALSE(),CALCULATE(SUM('Table'[amount]),FILTER(ALL('Table'),MONTH('Table'[date])=12&&YEAR('Table'[date])=SELECTEDVALUE(Slicer[Year]))),
    BLANK())
3. Place the measure in the Filter, select is =1, Apply filter.
4. Result.
By default, the data for the month of 2021.3 are displayed:
Select 2020, you should display the data for 202012:
Select 201910, it will display the data for October 2019:
Best Regards,
Liu Yang
If this post helps, then please consider Accept it as the solution to help the other members find it more quickly.
- Mark as New
- Bookmark
- Subscribe
- Mute
- Subscribe to RSS Feed
- Permalink
- Report Inappropriate Content
@pradeept , You have to create columns like these on you date Table
Month Type = Switch( True(),
eomonth([Date],0)= eomonth(Today(),0),"Current Month" ,
eomonth([Date],0) = eomonth(Today(),-1),"Last Month" ,
Format([Date],"MMM-YYYY")
)
Year Type = Switch( True(),
year([Date])= year(Today()),"This Year" ,
Format([Date],"YYYY")
)
Select This Year and current month
refer my video
https://www.youtube.com/watch?v=hfn05preQYA
Microsoft Power BI Learning Resources, 2023 !!
Learn Power BI - Full Course with Dec-2022, with Window, Index, Offset, 100+ Topics !!
Did I answer your question? Mark my post as a solution! Appreciate your Kudos !! Proud to be a Super User! !!
- Mark as New
- Bookmark
- Subscribe
- Mute
- Subscribe to RSS Feed
- Permalink
- Report Inappropriate Content
@amitchandak thanks for you suggestion. but this is not what I am looking for exactly.
Step-1:
When we open the page/dashboard, by default Year/Month should be filtered automatically for "This Year" and "This Month" . There should not be any manual process for selections. (labels should be '2021', '202103')
Step-2:
After analysing the charts/reports for latest period, if any further analysis required then we will select the necessary time periods.
Thanks, pradeep
Helpful resources

Microsoft Fabric Learn Together
Covering the world! 9:00-10:30 AM Sydney, 4:00-5:30 PM CET (Paris/Berlin), 7:00-8:30 PM Mexico City

Power BI Monthly Update - April 2024
Check out the April 2024 Power BI update to learn about new features.

| User | Count |
|---|---|
| 109 | |
| 96 | |
| 77 | |
| 66 | |
| 54 |
| User | Count |
|---|---|
| 144 | |
| 104 | |
| 102 | |
| 88 | |
| 63 |


