- Power BI forums
- Updates
- News & Announcements
- Get Help with Power BI
- Desktop
- Service
- Report Server
- Power Query
- Mobile Apps
- Developer
- DAX Commands and Tips
- Custom Visuals Development Discussion
- Health and Life Sciences
- Power BI Spanish forums
- Translated Spanish Desktop
- Power Platform Integration - Better Together!
- Power Platform Integrations (Read-only)
- Power Platform and Dynamics 365 Integrations (Read-only)
- Training and Consulting
- Instructor Led Training
- Dashboard in a Day for Women, by Women
- Galleries
- Community Connections & How-To Videos
- COVID-19 Data Stories Gallery
- Themes Gallery
- Data Stories Gallery
- R Script Showcase
- Webinars and Video Gallery
- Quick Measures Gallery
- 2021 MSBizAppsSummit Gallery
- 2020 MSBizAppsSummit Gallery
- 2019 MSBizAppsSummit Gallery
- Events
- Ideas
- Custom Visuals Ideas
- Issues
- Issues
- Events
- Upcoming Events
- Community Blog
- Power BI Community Blog
- Custom Visuals Community Blog
- Community Support
- Community Accounts & Registration
- Using the Community
- Community Feedback
Register now to learn Fabric in free live sessions led by the best Microsoft experts. From Apr 16 to May 9, in English and Spanish.
- Power BI forums
- Forums
- Get Help with Power BI
- Desktop
- Re: DAX performance optimization
- Subscribe to RSS Feed
- Mark Topic as New
- Mark Topic as Read
- Float this Topic for Current User
- Bookmark
- Subscribe
- Printer Friendly Page
- Mark as New
- Bookmark
- Subscribe
- Mute
- Subscribe to RSS Feed
- Permalink
- Report Inappropriate Content
DAX performance optimization
Hello Community,
It will be a long post, sorry guys but I'm really in need of help.
I have a DAX for ranking and segmenting users based on consumption but it has big performance issues. It takes way more than a minute - or it times out - to calculate it on a monthly date range for example.
Below I'll try to add all the details you might need.
Model:
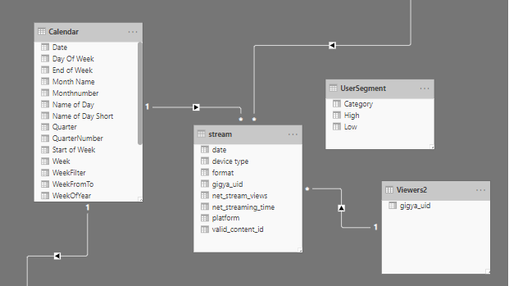
basic calendar table: has a relationship with stream on Date-date
stream table: contains consumption on a daily-user-content-platform level so pretty detailed and huge: about 52m rows for 8 months period
and here is the DAX I use:
the goal is to categorize the users based on their consumption and to tel for instance that the "heavy" category which contains the top 25% of the users in the given time period is responsible for the 70% of the consumption
The idea of the solution comes from the @EnterpriseDNA youtube channel.
//simple sum of views:
Net Stream views = SUM(stream[net_stream_views])
//the rank based on views where I rank the users if they had at least 1 view in the given period:
ViewRank = IF(ISBLANK( [Net Stream views]),BLANK(),
        RANKX(
            FILTER(ALL(Viewers2),NOT( ISBLANK([Net Stream views] ) ) ),[Net Stream views],,DESC,Skip))
//the segmentation where I'm trying to iterate throug the viewers and categorize them
//to the categories located in the UserSegments table based on the useres rank Segmentation = VAR RankingDimension = VALUES( Viewers2[gigya_uid] ) VAR TotalCustomers = CALCULATE(COUNTROWS(Viewers2), FILTER( ALL(Viewers2[gigya_uid] ),[Net Stream views] > 0 )) RETURN CALCULATE( [Net Stream views], FILTER( RankingDimension, COUNTROWS( FILTER( UserSegment, [ViewRank] > TotalCustomers * UserSegment[Low] && [ViewRank] <= TotalCustomers * UserSegment[High] ) ) > 0 ) )
what I'm trying to get is something like this for example:
Is it possible to optimize this solution to boost performance or to solve it a different way to keep it dynamic?
If you need any other detail don't hesitate to ask. 🙂
Thanks for your time in advance.
Bests,
Barna
- Mark as New
- Bookmark
- Subscribe
- Mute
- Subscribe to RSS Feed
- Permalink
- Report Inappropriate Content
hi, @Barnee
Could you share your sample pbix file for us have a test? (remove other columns and just keep some necessary column that could reproduce this case).
Best Regards,
Lin
If this post helps, then please consider Accept it as the solution to help the other members find it more quickly.
- Mark as New
- Bookmark
- Subscribe
- Mute
- Subscribe to RSS Feed
- Permalink
- Report Inappropriate Content
hi Lin @v-lili6-msft ,
here it is with dummy data but same structure:
https://drive.google.com/file/d/1ifXB2wcYeuGLea0bcQXdGT4rW_FB3pRv/view?usp=sharing
the original has about 52 million rows in the stream table and 1.3 million in the Viewers2 table.
thanks
Barna
- Mark as New
- Bookmark
- Subscribe
- Mute
- Subscribe to RSS Feed
- Permalink
- Report Inappropriate Content
Helpful resources

Microsoft Fabric Learn Together
Covering the world! 9:00-10:30 AM Sydney, 4:00-5:30 PM CET (Paris/Berlin), 7:00-8:30 PM Mexico City

Power BI Monthly Update - April 2024
Check out the April 2024 Power BI update to learn about new features.

| User | Count |
|---|---|
| 110 | |
| 94 | |
| 82 | |
| 66 | |
| 58 |
| User | Count |
|---|---|
| 151 | |
| 121 | |
| 104 | |
| 87 | |
| 67 |


