- Power BI forums
- Updates
- News & Announcements
- Get Help with Power BI
- Desktop
- Service
- Report Server
- Power Query
- Mobile Apps
- Developer
- DAX Commands and Tips
- Custom Visuals Development Discussion
- Health and Life Sciences
- Power BI Spanish forums
- Translated Spanish Desktop
- Power Platform Integration - Better Together!
- Power Platform Integrations (Read-only)
- Power Platform and Dynamics 365 Integrations (Read-only)
- Training and Consulting
- Instructor Led Training
- Dashboard in a Day for Women, by Women
- Galleries
- Community Connections & How-To Videos
- COVID-19 Data Stories Gallery
- Themes Gallery
- Data Stories Gallery
- R Script Showcase
- Webinars and Video Gallery
- Quick Measures Gallery
- 2021 MSBizAppsSummit Gallery
- 2020 MSBizAppsSummit Gallery
- 2019 MSBizAppsSummit Gallery
- Events
- Ideas
- Custom Visuals Ideas
- Issues
- Issues
- Events
- Upcoming Events
- Community Blog
- Power BI Community Blog
- Custom Visuals Community Blog
- Community Support
- Community Accounts & Registration
- Using the Community
- Community Feedback
Register now to learn Fabric in free live sessions led by the best Microsoft experts. From Apr 16 to May 9, in English and Spanish.
- Power BI forums
- Forums
- Get Help with Power BI
- Desktop
- DAX measure calculate hours for each day
- Subscribe to RSS Feed
- Mark Topic as New
- Mark Topic as Read
- Float this Topic for Current User
- Bookmark
- Subscribe
- Printer Friendly Page
- Mark as New
- Bookmark
- Subscribe
- Mute
- Subscribe to RSS Feed
- Permalink
- Report Inappropriate Content
DAX measure calculate hours for each day
Hi Community!
I have a report I'm working on, and I need to calculate the hours that were logged every day.
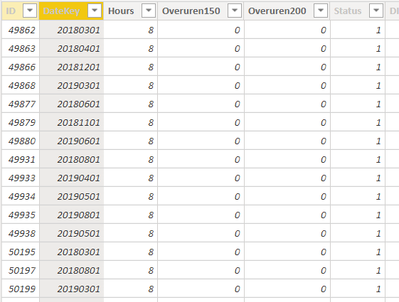
The problem I'm having is that the hours seem to calculate alright for each day in the data view.
It calculates per employee the number of hours worked on a certain day.
However, when I drag hours into the view it automatically aggregates it to month:
I tried to make a measure called CorrectBillableHours that looks the following:
CALCULATE(MIN(BillableHours[Hours]); Date[FullDate]) but this just sums the hours to 160 for every date as you can see in the example.
How can I fix this that it just shows the amount of Hours worked for each day?
Is it a data model problem? Am I using a wrong measure?
Thanks for the help in advance.
Solved! Go to Solution.
- Mark as New
- Bookmark
- Subscribe
- Mute
- Subscribe to RSS Feed
- Permalink
- Report Inappropriate Content
Hi @Anonymous ,
Since there is no specific PBIX file,I have tried to select part of data and provide two ways to solve your problems:
1.You can create the following measure directly to calculate the hours that were logged every day:
Total = CALCULATE(SUM('BillableHours'[Hours]) ,FILTER('BillableHours','BillableHours'[DateKey] in FILTERS('Date'[FullDate])))
You will get the result like this:

2.Create relationships between two tables but you should change the Datekey’s data type first:
Select Edit Queries and in Transform plate, choose Datekey column and change the data type into date, close and apply Edit Queries

Then in Home plate, select Manage Relationships, create relationships between two tables when you select Datekey column and FullDate column

Finally choose a table visual and put FullDate column and Hours column in it, you will get the result like this:

Here is the demo , please try it:
Best Regards,
Yingjie Li
If this post helps then please consider Accept it as the solution to help the other members find it more quickly.
- Mark as New
- Bookmark
- Subscribe
- Mute
- Subscribe to RSS Feed
- Permalink
- Report Inappropriate Content
Hi @Anonymous ,
Since there is no specific PBIX file,I have tried to select part of data and provide two ways to solve your problems:
1.You can create the following measure directly to calculate the hours that were logged every day:
Total = CALCULATE(SUM('BillableHours'[Hours]) ,FILTER('BillableHours','BillableHours'[DateKey] in FILTERS('Date'[FullDate])))
You will get the result like this:

2.Create relationships between two tables but you should change the Datekey’s data type first:
Select Edit Queries and in Transform plate, choose Datekey column and change the data type into date, close and apply Edit Queries

Then in Home plate, select Manage Relationships, create relationships between two tables when you select Datekey column and FullDate column

Finally choose a table visual and put FullDate column and Hours column in it, you will get the result like this:

Here is the demo , please try it:
Best Regards,
Yingjie Li
If this post helps then please consider Accept it as the solution to help the other members find it more quickly.
- Mark as New
- Bookmark
- Subscribe
- Mute
- Subscribe to RSS Feed
- Permalink
- Report Inappropriate Content
just right click on column and click on "Don't summerize".
Thanks & regards,
Pravin Wattamwar
www.linkedin.com/in/pravin-p-wattamwar
If I resolve your problem Mark it as a solution and give kudos.
- Mark as New
- Bookmark
- Subscribe
- Mute
- Subscribe to RSS Feed
- Permalink
- Report Inappropriate Content
I've tried that but it still gives the same result.
- Mark as New
- Bookmark
- Subscribe
- Mute
- Subscribe to RSS Feed
- Permalink
- Report Inappropriate Content
share your pbix.
Helpful resources

Microsoft Fabric Learn Together
Covering the world! 9:00-10:30 AM Sydney, 4:00-5:30 PM CET (Paris/Berlin), 7:00-8:30 PM Mexico City

Power BI Monthly Update - April 2024
Check out the April 2024 Power BI update to learn about new features.

| User | Count |
|---|---|
| 113 | |
| 97 | |
| 85 | |
| 70 | |
| 61 |
| User | Count |
|---|---|
| 151 | |
| 121 | |
| 104 | |
| 87 | |
| 67 |


