- Power BI forums
- Updates
- News & Announcements
- Get Help with Power BI
- Desktop
- Service
- Report Server
- Power Query
- Mobile Apps
- Developer
- DAX Commands and Tips
- Custom Visuals Development Discussion
- Health and Life Sciences
- Power BI Spanish forums
- Translated Spanish Desktop
- Power Platform Integration - Better Together!
- Power Platform Integrations (Read-only)
- Power Platform and Dynamics 365 Integrations (Read-only)
- Training and Consulting
- Instructor Led Training
- Dashboard in a Day for Women, by Women
- Galleries
- Community Connections & How-To Videos
- COVID-19 Data Stories Gallery
- Themes Gallery
- Data Stories Gallery
- R Script Showcase
- Webinars and Video Gallery
- Quick Measures Gallery
- 2021 MSBizAppsSummit Gallery
- 2020 MSBizAppsSummit Gallery
- 2019 MSBizAppsSummit Gallery
- Events
- Ideas
- Custom Visuals Ideas
- Issues
- Issues
- Events
- Upcoming Events
- Community Blog
- Power BI Community Blog
- Custom Visuals Community Blog
- Community Support
- Community Accounts & Registration
- Using the Community
- Community Feedback
Register now to learn Fabric in free live sessions led by the best Microsoft experts. From Apr 16 to May 9, in English and Spanish.
- Power BI forums
- Forums
- Get Help with Power BI
- Desktop
- Re: DAX RELATED() with MANY-TO-MANY RELATIONSHIP
- Subscribe to RSS Feed
- Mark Topic as New
- Mark Topic as Read
- Float this Topic for Current User
- Bookmark
- Subscribe
- Printer Friendly Page
- Mark as New
- Bookmark
- Subscribe
- Mute
- Subscribe to RSS Feed
- Permalink
- Report Inappropriate Content
DAX RELATED() with MANY-TO-MANY RELATIONSHIP
Hi All,
Consider the following transaction table:
| ATTR 1 | ATTR 2 | DATE 1 | DATE 2 | WEEK 1 | WEEK 2 | AMOUNT |
| A | B | 1/1/2019 | 1/8/2019 | 201901 | 201902 | 10 |
| A | B | 12/26/2018 | 1/8/2019 | 201852 | 201902 | 20 |
| A | B | 1/1/2019 | 1/15/2019 | 201901 | 201903 | 30 |
| A | B | 1/8/2019 | 1/15/2019 | 201902 | 201903 | 30 |
| C | D | 1/1/2019 | 1/8/2019 | 201901 | 201902 | 10 |
DATE1 is a Posting Date and DATE2 is the clearing date of the transaction. WEEK1 and WEEK2 are the fiscal weeks of DATE1 and DATE2 respectively. ATTR are random attributes of the transaction. I need to report the transaction amounts by the 'week of' for the attributes. For example, this SQL Case Statement is what I need to replicate:
SUM(CAST(CASE WHEN WEEK 2 > 201902 AND WEEK 1 <= 201902
THEN AMOUNT
ELSE (
CASE WHEN WEEK 1<= 201902 AND DATE 2 IS NULL
THEN AMOUNT
ELSE 0
END)
END AS DECIMAL(17,2))) AS AMT_201902
The output:
| ATTR 1 | ATTR 2 | AMT_201852 | AMT_201901 | AMT_201902 |
| A | B | 20 | 60 | 60 |
| C | D | 0 | 10 | 0 |
In order to avoid creating manual columns for each week, I created a seperate table to create a week range for all the weeks involved. The Range column will be put as columns in my Power Bi Matrix and the Amount in Values.
| WEEK 1 | WEEK 2 | RANGE |
| 201901 | 201902 | 201901 |
| 201901 | 201902 | 201902 |
| 201852 | 201902 | 201852 |
| 201852 | 201902 | 201901 |
| 201852 | 201902 | 201902 |
| 201901 | 201903 | 201901 |
| 201901 | 201903 | 201902 |
| 201901 | 201903 | 201903 |
| 201902 | 201903 | 201902 |
| 201902 | 201903 | 201903 |
The relationship between these two tables becomes many-to-many. How do I use Related or Relatedtable function to calculate to calculate the amounts?
I further divided the table above as a bridge table, but I still couldn't figure out how to use RELATED to get the Amounts.
Thanks!
Solved! Go to Solution.
- Mark as New
- Bookmark
- Subscribe
- Mute
- Subscribe to RSS Feed
- Permalink
- Report Inappropriate Content
Hi @apollo89
You may add key columns and link the two tables as below.Then you may create a measure to get the value.Attached the file for your reference.

Measure =
IF (
    SELECTEDVALUE ( Table2[RANGE] ) = 201902,
    SUMX (
        Table1,
        IF (
            Table1[WEEK 2] > 201902
                && Table1[WEEK 1] <= 201902,
            Table1[AMOUNT],
            IF ( Table1[WEEK 1] <= 201902 && Table1[DATE 2] = BLANK (), Table1[AMOUNT], 0 )
        )
    ),
    CALCULATE ( SUM ( Table1[AMOUNT] ) )
)
    + 0
Regards,
Cherie
If this post helps, then please consider Accept it as the solution to help the other members find it more quickly.
- Mark as New
- Bookmark
- Subscribe
- Mute
- Subscribe to RSS Feed
- Permalink
- Report Inappropriate Content
Hi, regardless of whatever method or logic to solve this issue, you must avoid using IF inside iterators as this will call CALLBACKDATAID where SE will be embedded with FE.
My recommendation use this
- Mark as New
- Bookmark
- Subscribe
- Mute
- Subscribe to RSS Feed
- Permalink
- Report Inappropriate Content
https://www.sqlbi.com/articles/many-to-many-relationships-in-power-bi-and-excel-2016/
The “classical” way to manage many-to-many relationships
As you can read in articles and white papers, DAX always offered a syntax to manage many-to-many relationships. For example, consider the following data model, where each customer can have more accounts and each account can belong to many customers. Each row in BridgeAccountsCustomers table defines a relationship between one account and one customer.
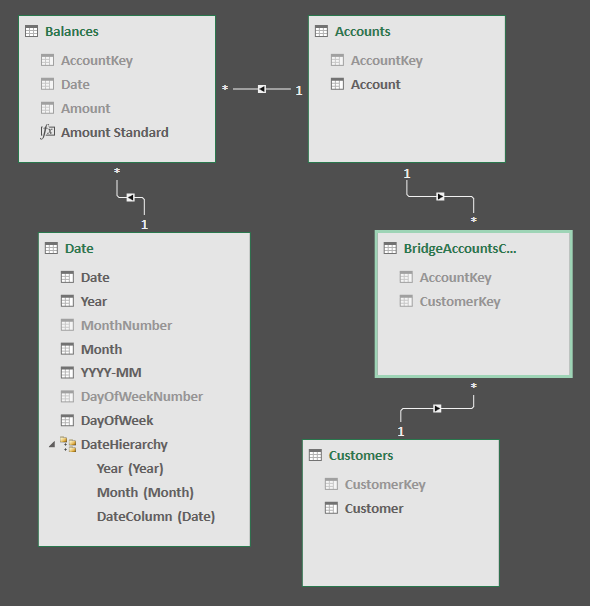
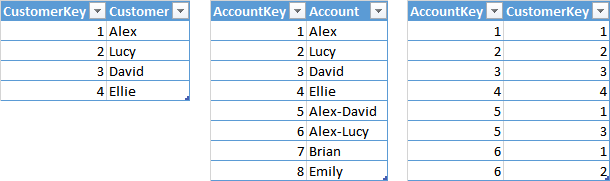
The following is the content of the Customers, BridgeAccountsCustomers, and Accounts tables.
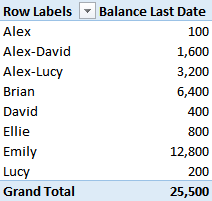
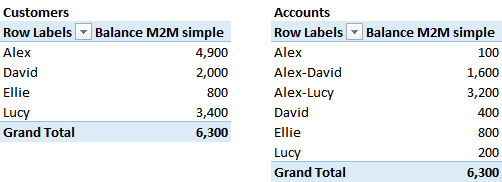
The measure “Balance” should display the value of the balance at the last day for all the accounts, assuming that the balance is available for all the accounts at a given date. This should result in the following report for the sum of account balances at the end of 2016:
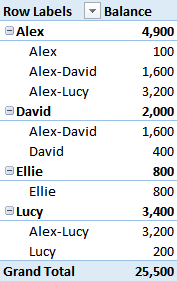
The goal is to display for every customer the value of all of the accounts, displaying this final result:
In Power Pivot for Excel 2010/2013, and in Analysis Services 2012/2014, you can write the balance measure using the following syntax, which leverages the expanded bridge table in the filter context.
1 2 3 4 5 | Balance M2M simple := CALCULATE ( [Balance Last Date], BridgeAccountsCustomers ) |
However, this formula applies the filter also when there is an account without any owner, as you can see in the following screenshot, where the accounts for Brian and Emily are not considered, even in the grand total. Hiding data of orphaned accounts could be an undesired side effect for the reports.
In order to apply the filter only when there is a selection of one or more customers, you have to duplicate the code, because we do not have a conditional table function.
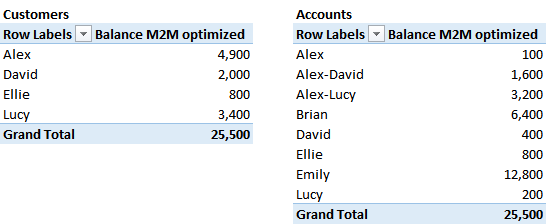
1 2 3 4 5 | Balance M2M optimized:=IF ( ISCROSSFILTERED ( Customers[CustomerKey] ), CALCULATE ( [Balance Last Date], BridgeAccountsCustomers ), [Balance Last Date] ) |
Using this measure, the accounts of Brian and Emily are visible in the grand total and in the details of the accounts, even if they are not displayed for any customer.
Applying the filter to handle the many-to-many relationship even when it is not required involves an additional cost, which can be avoided using this last version of the Balance measure. However, the code becomes more complex and we might want to find a better way to manage that.
The “new” way using bidirectional filters
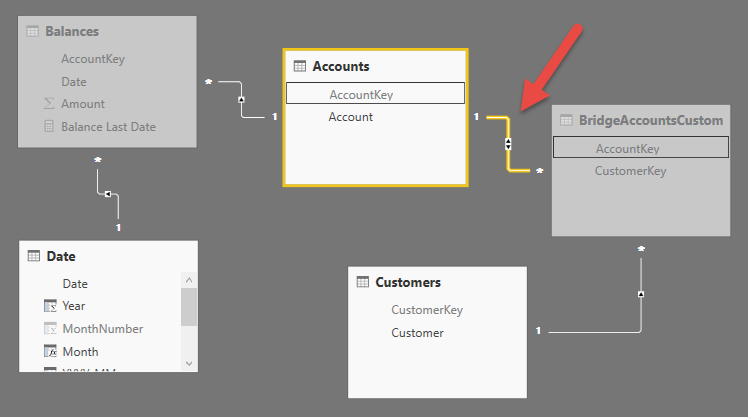
In Power BI Desktop and in Analysis Services 2016, we have an excellent solution to this problem. By enabling a bidirectional filter (Exact description from dialog box) between the BridgeAccountsCustomers and Accounts tables, all the measures receive the filter context from the bridge table in case one or more customers are selected. If there are no active filters on customers, which means that you see the value for all the customers, the filter is not applied at all to the accounts. Therefore, you pay the price of the filter propagation through a bidirectional filter only when this is really required, and this does not require any single line of DAX in your measures.
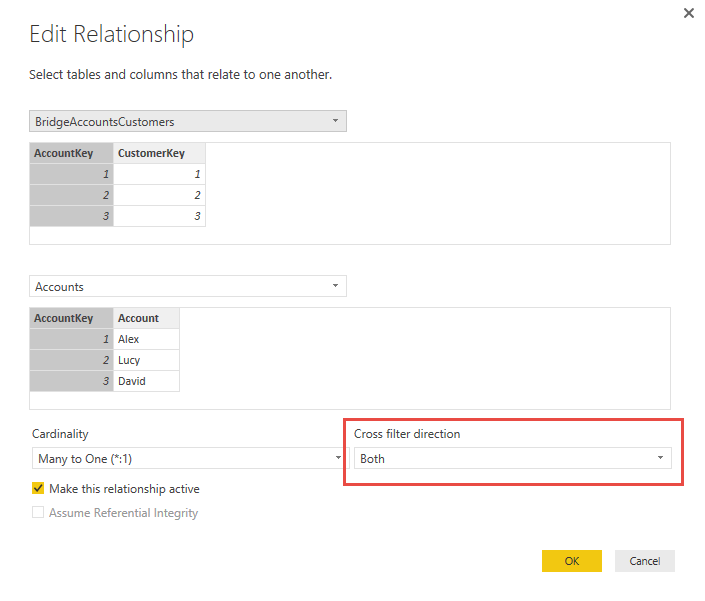
The following picture shows the configuration of the relationships in Power BI and the detail of the bidirectional filter active in the relationship between BridgeAccountsCustomers and Account.
This solution is not available in Excel 2016, because you cannot set a bidirectional filter on a relationship in the data model. However, the DAX engine in Excel 2016 has the same capabilities of Power BI in terms of bidirectional propagation of the filters, but we have to write a line of DAX code to use it.
The function CROSSFILTER is new in Excel 2016, Power BI, and Analysis Services 2016. It replaces USERELATIONSHIP and adds a third argument that provides the ability to modify the direction of propagation of the filter in a relationship. You can use the following arguments: None, OneWay, Both. For our purposes, we can use BOTH on the relationship between BridgeAccountsCustomers and Account, obtaining the same effect of the bidirectional filter set in the data model.
1 2 3 4 5 | Balance M2M 2016:= CALCULATE ( [Balance Last Date], CROSSFILTER ( BridgeAccountsCustomers[AccountKey], Accounts[AccountKey], Both ) ) |
As with previous versions of Excel, we still have to write this filter in CALCULATE for each measure interested in a many-to-many relationship, but using CROSSFILTER you get the same behavior of the optimized measure you have seen for Excel 2010/3, which required a test calling ISCROSSFILTERED in order to apply the many-to-many filter only if necessary.
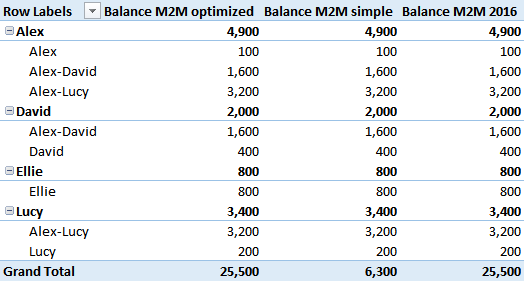
You can see in the next screenshot that the last measure (Balance M2M 2016) produces the same result of Balance M2M optimized we wrote for Excel 2013 compatibility.
Conclusion
Leveraging bidirectional filters to implement many-to-many relationships is the best approach in order to obtain the correct results and the best performance with the simplest DAX code. You can set bidirectional filters in the data model in Power BI Desktop and Analysis Services 2016. This is not possible in Excel 2016 at the data model level, but you can leverage on the CROSSFILTER function in Excel 2016, obtaining the same performance with a minimal impact on DAX code.
- Mark as New
- Bookmark
- Subscribe
- Mute
- Subscribe to RSS Feed
- Permalink
- Report Inappropriate Content
Hi @apollo89
You may add key columns and link the two tables as below.Then you may create a measure to get the value.Attached the file for your reference.
Measure =
IF (
    SELECTEDVALUE ( Table2[RANGE] ) = 201902,
    SUMX (
        Table1,
        IF (
            Table1[WEEK 2] > 201902
                && Table1[WEEK 1] <= 201902,
            Table1[AMOUNT],
            IF ( Table1[WEEK 1] <= 201902 && Table1[DATE 2] = BLANK (), Table1[AMOUNT], 0 )
        )
    ),
    CALCULATE ( SUM ( Table1[AMOUNT] ) )
)
    + 0
Regards,
Cherie
If this post helps, then please consider Accept it as the solution to help the other members find it more quickly.
- Mark as New
- Bookmark
- Subscribe
- Mute
- Subscribe to RSS Feed
- Permalink
- Report Inappropriate Content
If you do (both direction) on 2 tables with relationship this will effect the performance negatively, it is not recommended to put (both direction).
- Mark as New
- Bookmark
- Subscribe
- Mute
- Subscribe to RSS Feed
- Permalink
- Report Inappropriate Content
This works Cherie! Thanks a lot!
I was under the impression that only RELATED and RELATEDTABLE works across tables.
Thanks again!
- Mark as New
- Bookmark
- Subscribe
- Mute
- Subscribe to RSS Feed
- Permalink
- Report Inappropriate Content
Hi Cherie,
I had a question about how the SELECTEDVALUE function is working.
When you say SELECTEDVALUE ( Table2[RANGE] ) = 201902, how is it getting a value of 201902 because as per my understanding of SELECTEDVALUE, it will return a BLANK when it finds mutliple values in the filter contecxt. In this case the IF will always be false.
Thanks
Helpful resources

Microsoft Fabric Learn Together
Covering the world! 9:00-10:30 AM Sydney, 4:00-5:30 PM CET (Paris/Berlin), 7:00-8:30 PM Mexico City

Power BI Monthly Update - April 2024
Check out the April 2024 Power BI update to learn about new features.

Fabric Community Update - April 2024
Find out what's new and trending in the Fabric Community.

| User | Count |
|---|---|
| 107 | |
| 97 | |
| 75 | |
| 65 | |
| 53 |
| User | Count |
|---|---|
| 144 | |
| 103 | |
| 98 | |
| 85 | |
| 64 |