- Power BI forums
- Updates
- News & Announcements
- Get Help with Power BI
- Desktop
- Service
- Report Server
- Power Query
- Mobile Apps
- Developer
- DAX Commands and Tips
- Custom Visuals Development Discussion
- Health and Life Sciences
- Power BI Spanish forums
- Translated Spanish Desktop
- Power Platform Integration - Better Together!
- Power Platform Integrations (Read-only)
- Power Platform and Dynamics 365 Integrations (Read-only)
- Training and Consulting
- Instructor Led Training
- Dashboard in a Day for Women, by Women
- Galleries
- Community Connections & How-To Videos
- COVID-19 Data Stories Gallery
- Themes Gallery
- Data Stories Gallery
- R Script Showcase
- Webinars and Video Gallery
- Quick Measures Gallery
- 2021 MSBizAppsSummit Gallery
- 2020 MSBizAppsSummit Gallery
- 2019 MSBizAppsSummit Gallery
- Events
- Ideas
- Custom Visuals Ideas
- Issues
- Issues
- Events
- Upcoming Events
- Community Blog
- Power BI Community Blog
- Custom Visuals Community Blog
- Community Support
- Community Accounts & Registration
- Using the Community
- Community Feedback
Register now to learn Fabric in free live sessions led by the best Microsoft experts. From Apr 16 to May 9, in English and Spanish.
- Power BI forums
- Forums
- Get Help with Power BI
- Desktop
- Re: Custom column measures
- Subscribe to RSS Feed
- Mark Topic as New
- Mark Topic as Read
- Float this Topic for Current User
- Bookmark
- Subscribe
- Printer Friendly Page
- Mark as New
- Bookmark
- Subscribe
- Mute
- Subscribe to RSS Feed
- Permalink
- Report Inappropriate Content
Custom column measures
Hi everyone, I am probably doing something wrong here...
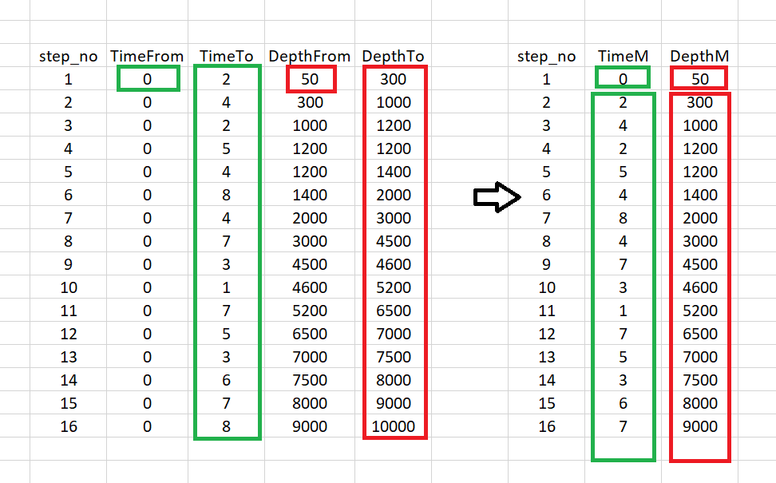
I have a table that contains these 5 columns on the left (the picture below). So I've created (with your help) two measures called TimeM and DepthM from original columns TimeFrom/TimeTo and DepthFrom/DepthTo respectively. So it basically copies first rows from TimeFrom and DepthFrom into the corresponding measures, and copies entire columns TimeTo and DepthTo, all of them are filtered by the step_no. The problem is that during this transformation the last row from both TimeTo (value 😎 and DepthTo (value 10000) is not visible in TimeM and DepthM visual as there no steps after step_no 16.
How can I plot these two measures TimeM and DepthM without missing the last row from original columns? I am not allowed to add more rows to the step_no column, the order and number of steps should stay the same. What about creating an extra column that is related to the step_no and can be extended to include 17 rows?
- Mark as New
- Bookmark
- Subscribe
- Mute
- Subscribe to RSS Feed
- Permalink
- Report Inappropriate Content
maybe you can try create a new table for this
newtable =
VAR first=SELECTCOLUMNS(FILTER('Table','Table'[step_no]=min('Table'[step_no])),"stop_no",'Table'[step_no],"TimeM",'Table'[timefrom],"DepthM",'Table'[depthfrom])
VAR middle=SELECTCOLUMNS(FILTER('Table','Table'[step_no]>min('Table'[step_no])),"stop_no",'Table'[step_no],"TimeM",MAXX(FILTER('Table','Table'[step_no]=EARLIER('Table'[step_no])-1),'Table'[timeto]),"DepthM",MAXX(FILTER('Table','Table'[step_no]=EARLIER('Table'[step_no])-1),'Table'[depthto]))
VAR last=SELECTCOLUMNS(FILTER('Table','Table'[step_no]=max('Table'[step_no])),"stop_no","","TimeM",'Table'[timeto],"DepthM",'Table'[depthto])
return union(first,middle,last)
I only used 10 rows of your sample data
Did I answer your question? Mark my post as a solution!
Proud to be a Super User!
- Mark as New
- Bookmark
- Subscribe
- Mute
- Subscribe to RSS Feed
- Permalink
- Report Inappropriate Content
@ryan_mayu would I be able to plot DepthM vs TimeM then?
I've also run into this:
The expression refers to multiple columns. Multiple columns cannot be converted to a scalar value.
- Mark as New
- Bookmark
- Subscribe
- Mute
- Subscribe to RSS Feed
- Permalink
- Report Inappropriate Content
Yes, I think so, that was a new table. could you please share more details of plotting depthM and timeM?
Did I answer your question? Mark my post as a solution!
Proud to be a Super User!
- Mark as New
- Bookmark
- Subscribe
- Mute
- Subscribe to RSS Feed
- Permalink
- Report Inappropriate Content
timeM = maxx(filter(Table, [step_no] =earlier([step_no]) -1),[Time_no])
Depth M seems same as Depth from ?
Microsoft Power BI Learning Resources, 2023 !!
Learn Power BI - Full Course with Dec-2022, with Window, Index, Offset, 100+ Topics !!
Did I answer your question? Mark my post as a solution! Appreciate your Kudos !! Proud to be a Super User! !!
- Mark as New
- Bookmark
- Subscribe
- Mute
- Subscribe to RSS Feed
- Permalink
- Report Inappropriate Content
Hi @amitchandak thanks! couple of questions about this expression:
1. what is [Time_no] ?
2. can it be converted into a column instead?
Regarding Depth M, it is a copy of the column DepthTo starting from the second row down (first row is from the colmn DepthFrom).
Hope it makes it more understandable.
- Mark as New
- Bookmark
- Subscribe
- Mute
- Subscribe to RSS Feed
- Permalink
- Report Inappropriate Content
@amitchandak DepthM rows starting from the second are copies of rows from the DepthTo
Helpful resources

Microsoft Fabric Learn Together
Covering the world! 9:00-10:30 AM Sydney, 4:00-5:30 PM CET (Paris/Berlin), 7:00-8:30 PM Mexico City

Power BI Monthly Update - April 2024
Check out the April 2024 Power BI update to learn about new features.

| User | Count |
|---|---|
| 109 | |
| 98 | |
| 77 | |
| 66 | |
| 54 |
| User | Count |
|---|---|
| 144 | |
| 104 | |
| 101 | |
| 86 | |
| 64 |


