Register now to learn Fabric in free live sessions led by the best Microsoft experts. From Apr 16 to May 9, in English and Spanish.
Hello,
I've been struggling with my data to get what I need, I could solve some of the problems, but couldn't put everything togheter:
I have 7 meters which record data every 15 minutes, I have an output like this:
Time | Meter | Value |
00:00 | A | 10 |
00:00 | B | 20 |
00:00 | C | 30 |
00:00 | D | 40 |
00:00 | E | 50 |
00:00 | F | 60 |
00:00 | G | 70 |
00:15 | A | 11 |
00:15 | B | 12 |
00:15 | C | 13 |
00:15 | D | 14 |
00:15 | E | 15 |
00:15 | F | 16 |
00:15 | G | 17 |
And so on, the readings are cumulative.
I managed get the daily (or weekly, etc) value from each meter using max and min functions and then filtering by meter directly in the report. The thing is, I need to do some math on the values so it would represent a real consumption, let's say:
C1 = A
C2 = B - C
C3 = C
C4 = D
C5 = E
C6 = F - G - E - D
C7 = G
C8 = A - B - F
Using max()-min() it was easy to have the total amout read by the meter in a period of time, I filtered it directly in the Report using the Visuals. But I can't figure out how to calculate and plot C1-8 with that ease.
I tried this solution:
https://community.powerbi.com/t5/Desktop/Add-calculated-index-column-by-DAX/td-p/72448
using lookupvalue(value;index;index-1) but it returned an error about finding more than one value of index
I also tried making one different table for each meter and then creating Measures for the measured consumption in C1-8 over time, but I couldn't relate the measures to the timestamp to plot them afterwards.
It seems like I'm missing something, any kind of tips about how structure this data would be appreciated.
Regards
Hi @AUGUSF,
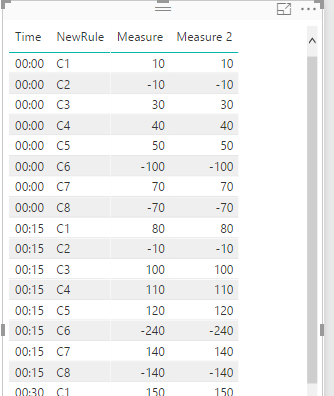
Do you want a table like it below? If so, you can try it in this file.
1. A new table of new mapping pairs. (Simple in my test)
NewMapping = CROSSJOIN ( VALUES ( Table1[Time] ), { "C1", "C2", "C3", "C4", "C5", "C6", "C7", "C8" } )
2. A bridge table.
Time = VALUES(Table1[Time])
3. Establish relationships.
4. Use a measure like below. (these two have same functions.)
Measure 2 = VAR newRule = MIN ( 'NewMapping'[NewRule] ) RETURN SWITCH ( newRule, "C1", CALCULATE ( SUM ( Table1[Value] ), 'Table1'[Meter] = "A" ), "C2", CALCULATE ( SUM ( Table1[Value] ), 'Table1'[Meter] = "B" ) - CALCULATE ( SUM ( Table1[Value] ), 'Table1'[Meter] = "C" ), "C3", CALCULATE ( SUM ( Table1[Value] ), 'Table1'[Meter] = "C" ), "C4", CALCULATE ( SUM ( Table1[Value] ), 'Table1'[Meter] = "D" ), "C5", CALCULATE ( SUM ( Table1[Value] ), 'Table1'[Meter] = "E" ), "C6", CALCULATE ( SUM ( Table1[Value] ), 'Table1'[Meter] = "F" ) - CALCULATE ( SUM ( Table1[Value] ), 'Table1'[Meter] = "G" ) - CALCULATE ( SUM ( Table1[Value] ), 'Table1'[Meter] = "E" ) - CALCULATE ( SUM ( Table1[Value] ), 'Table1'[Meter] = "D" ), "C7", CALCULATE ( SUM ( Table1[Value] ), 'Table1'[Meter] = "G" ), "C8", CALCULATE ( SUM ( Table1[Value] ), 'Table1'[Meter] = "A" ) - CALCULATE ( SUM ( Table1[Value] ), 'Table1'[Meter] = "B" ) - CALCULATE ( SUM ( Table1[Value] ), 'Table1'[Meter] = "F" ) )
Measure = VAR newRule = MIN ( 'NewMapping'[NewRule] ) RETURN IF ( newRule = "C1", CALCULATE ( SUM ( Table1[Value] ), 'Table1'[Meter] = "A" ), IF ( newRule = "C2", CALCULATE ( SUM ( Table1[Value] ), 'Table1'[Meter] = "B" ) - CALCULATE ( SUM ( Table1[Value] ), 'Table1'[Meter] = "C" ), IF ( newRule = "C3", CALCULATE ( SUM ( Table1[Value] ), 'Table1'[Meter] = "C" ), IF ( newRule = "C4", CALCULATE ( SUM ( Table1[Value] ), 'Table1'[Meter] = "D" ), IF ( newRule = "C5", CALCULATE ( SUM ( Table1[Value] ), 'Table1'[Meter] = "E" ), IF ( newRule = "C6", CALCULATE ( SUM ( Table1[Value] ), 'Table1'[Meter] = "F" ) - CALCULATE ( SUM ( Table1[Value] ), 'Table1'[Meter] = "G" ) - CALCULATE ( SUM ( Table1[Value] ), 'Table1'[Meter] = "E" ) - CALCULATE ( SUM ( Table1[Value] ), 'Table1'[Meter] = "D" ), IF ( newRule = "C7", CALCULATE ( SUM ( Table1[Value] ), 'Table1'[Meter] = "G" ), IF ( newRule = "C8", CALCULATE ( SUM ( Table1[Value] ), 'Table1'[Meter] = "A" ) - CALCULATE ( SUM ( Table1[Value] ), 'Table1'[Meter] = "B" ) - CALCULATE ( SUM ( Table1[Value] ), 'Table1'[Meter] = "F" ) ) ) ) ) ) ) ) )
Best Regards,
Dale
Thanks for your answer Dale, I'll be trying this and reply the results afterwards.
Regards.
I would be helpful to either showed desired ouput or provide a sample file for someone to look at. It's not clear what your current data model structure is or what desired output is.
Hello mattbrice, thanks for your reply.
This is what my source looks like, they came from an ODBC server:
"SourceID" is the meter code, which I first stated as A, B, C.. And "Value" the cumulative readings, the numbers seems weird because this particular meter (8406) is not calibrated yet, but assume it's a cumulative column over time.
I want my output to be what was read by each meter in a given period of time, then I should add or subtract some of them togheter to get the mass balance right as in C1, C2, etc.
I don't know if it's better/possible for my output (C1,C2...) to be a colum or a measure. I want the total daily value of Cn and plot it's value hourly.
Covering the world! 9:00-10:30 AM Sydney, 4:00-5:30 PM CET (Paris/Berlin), 7:00-8:30 PM Mexico City
Check out the April 2024 Power BI update to learn about new features.
User | Count |
---|---|
115 | |
100 | |
88 | |
69 | |
61 |
User | Count |
---|---|
152 | |
120 | |
102 | |
87 | |
68 |