- Power BI forums
- Updates
- News & Announcements
- Get Help with Power BI
- Desktop
- Service
- Report Server
- Power Query
- Mobile Apps
- Developer
- DAX Commands and Tips
- Custom Visuals Development Discussion
- Health and Life Sciences
- Power BI Spanish forums
- Translated Spanish Desktop
- Power Platform Integration - Better Together!
- Power Platform Integrations (Read-only)
- Power Platform and Dynamics 365 Integrations (Read-only)
- Training and Consulting
- Instructor Led Training
- Dashboard in a Day for Women, by Women
- Galleries
- Community Connections & How-To Videos
- COVID-19 Data Stories Gallery
- Themes Gallery
- Data Stories Gallery
- R Script Showcase
- Webinars and Video Gallery
- Quick Measures Gallery
- 2021 MSBizAppsSummit Gallery
- 2020 MSBizAppsSummit Gallery
- 2019 MSBizAppsSummit Gallery
- Events
- Ideas
- Custom Visuals Ideas
- Issues
- Issues
- Events
- Upcoming Events
- Community Blog
- Power BI Community Blog
- Custom Visuals Community Blog
- Community Support
- Community Accounts & Registration
- Using the Community
- Community Feedback
Register now to learn Fabric in free live sessions led by the best Microsoft experts. From Apr 16 to May 9, in English and Spanish.
- Power BI forums
- Forums
- Get Help with Power BI
- Desktop
- Re: Cumulative Total and Net Incremental Cost
- Subscribe to RSS Feed
- Mark Topic as New
- Mark Topic as Read
- Float this Topic for Current User
- Bookmark
- Subscribe
- Printer Friendly Page
- Mark as New
- Bookmark
- Subscribe
- Mute
- Subscribe to RSS Feed
- Permalink
- Report Inappropriate Content
Cumulative Total and Net Incremental Cost
Hello greatest support community in the known web!
Leadership wants to see change in incremental cost over time. In this case, incremental cost is the difference in the hourly rate of travelers and regular staff. Travelers are much more expensive. This Cumulative Total thread was very helpful in getting cumulative incremental cost for contract starts but I am struggling to write a measure that will give me cumulative cost based on contract end date.
Data Model Notes
I have a DateDim table and TravelerFact table. Inactive relationships from DateDim.DateValue to TravelerFact.Start Date and TravelerFact.EndDate. Start date is the date a contract starts and end date is the date the contract ends.
Sample Traveler Data
TravelerFact_Sample (Google Sheet). Note that not on the sheet is a calculated column I created for "Start Year-Week", based on Start Date.
Measures:
This one works as expected:
Contract Starts Incremental Cost =
CALCULATE (
    SUM ( TravelerFact[HourlyRateDiff] ),
    FILTER (
        ALL ( TravelerFact ),
        TravelerFact[Start Date] <= MAX ( TravelerFact[Start Date] )
    ),
    USERELATIONSHIP ( TravelerFact[Start Date], DateDim[DateValue] )
)
Then I tried the same for contract end date to see how much cost is "rolling off" each week as contracts end.
Contract Ends Incremental Cost =
CALCULATE (
    SUM ( TravelerFact[HourlyRateDiff] ),
    FILTER (
        ALL ( TravelerFact ),
        TravelerFact[End Date] <= MIN ( TravelerFact[End Date] )
    ),
    USERELATIONSHIP ( TravelerFact[End Date], DateDim[DateValue] )
)
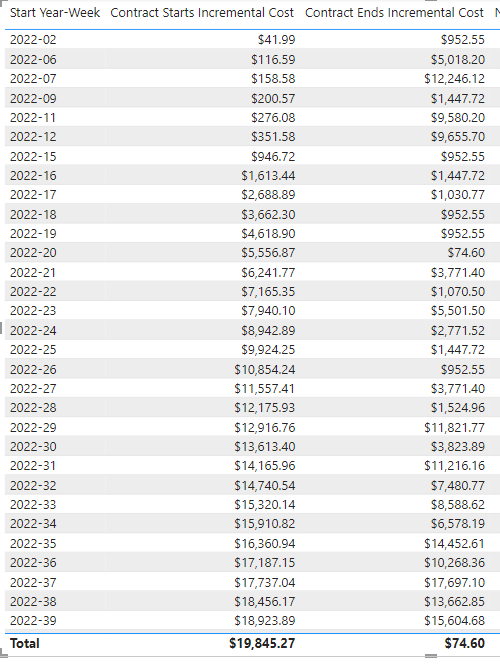
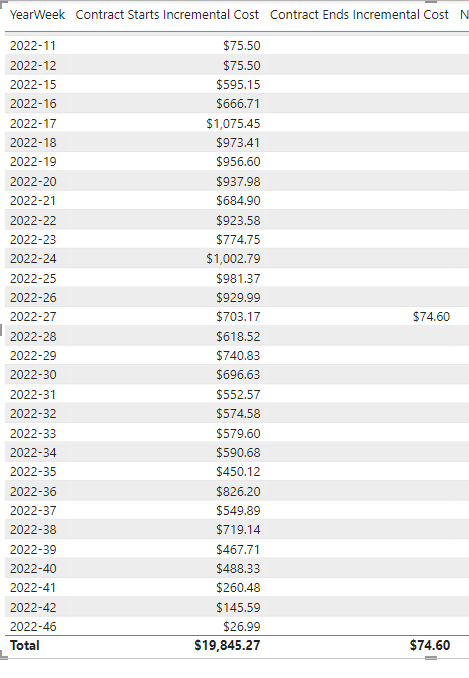
I end up with tables like the below with unexpected values in Contract Ends Incremental Cost. In the first table I would expect rows to be blank until about week 27 because the earliest contract end date is 1 July 2022. In the second I would expect cumulative values starting with week 27 and on. How can I calulate the cumulative sum of HourlyRateDiff based on the End Date?
Solved! Go to Solution.
- Mark as New
- Bookmark
- Subscribe
- Mute
- Subscribe to RSS Feed
- Permalink
- Report Inappropriate Content
So, after a hint from a colleague including a couple videos on calculating total number of staff over time, and calculating staff turnover, I figured out the issue and created the following measures. Note that this solution requires having two inactive relationships: between a Date dimension table and both Start Date and End Date in the fact table.
Contract Starts Incremental Cost =
CALCULATE(
    SUM( TravelerFact[HourlyRateDiff] ),
    FILTER(
        VALUES( TravelerFact[Start Date] ),
        TravelerFact[Start Date] <= MAX ( DateDim[DateValue] )
    ),
    FILTER( VALUES(TravelerFact[End Date]),
    TravelerFact[End Date] >= MIN( DateDim[DateValue])
    )
)


Contract Ends Incremental Cost =
CALCULATE (
    SUM ( TravelerFact[HourlyRateDiff] ),
    FILTER (
        VALUES ( TravelerFact[End Date] ),
        TravelerFact[End Date] <= MIN ( DateDim[DateValue] )
    ),
    TravelerFact[End Date] <> BLANK () --not really needed as there are no blanks in this dataset
)
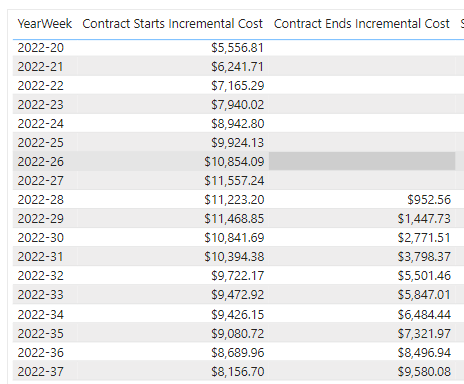
Now it is doing what I expected:
- Mark as New
- Bookmark
- Subscribe
- Mute
- Subscribe to RSS Feed
- Permalink
- Report Inappropriate Content
Hi @cathoms ,
Have you tried to create a year-month column in DateDim table, if not, please have a try.
Best Regards,
Community Support Team _ kalyj
If this post helps, then please consider Accept it as the solution to help the other members find it more quickly.
- Mark as New
- Bookmark
- Subscribe
- Mute
- Subscribe to RSS Feed
- Permalink
- Report Inappropriate Content
Not sure what a year-month column would do for me. I need to show this by week...
- Mark as New
- Bookmark
- Subscribe
- Mute
- Subscribe to RSS Feed
- Permalink
- Report Inappropriate Content
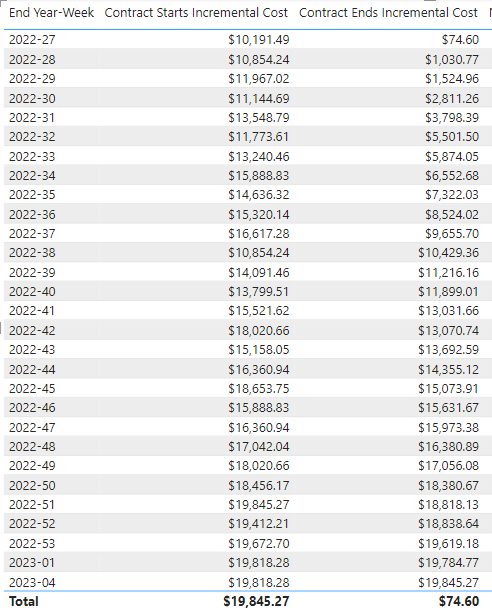
Quick addendum - the Contract Ends Incremental Cost works on my table if I use End Year-Week from my TravelerFact table (see below). The issue is, I need some way to correctly display both starts and ends incremental cost week to week from the beginning of the year on the same visual AND to calculate net weekly incremental cost, i.e. net cost starts - net cost ends.
Helpful resources

Microsoft Fabric Learn Together
Covering the world! 9:00-10:30 AM Sydney, 4:00-5:30 PM CET (Paris/Berlin), 7:00-8:30 PM Mexico City

Power BI Monthly Update - April 2024
Check out the April 2024 Power BI update to learn about new features.

| User | Count |
|---|---|
| 106 | |
| 94 | |
| 75 | |
| 62 | |
| 50 |
| User | Count |
|---|---|
| 147 | |
| 106 | |
| 104 | |
| 87 | |
| 61 |


