- Power BI forums
- Updates
- News & Announcements
- Get Help with Power BI
- Desktop
- Service
- Report Server
- Power Query
- Mobile Apps
- Developer
- DAX Commands and Tips
- Custom Visuals Development Discussion
- Health and Life Sciences
- Power BI Spanish forums
- Translated Spanish Desktop
- Power Platform Integration - Better Together!
- Power Platform Integrations (Read-only)
- Power Platform and Dynamics 365 Integrations (Read-only)
- Training and Consulting
- Instructor Led Training
- Dashboard in a Day for Women, by Women
- Galleries
- Community Connections & How-To Videos
- COVID-19 Data Stories Gallery
- Themes Gallery
- Data Stories Gallery
- R Script Showcase
- Webinars and Video Gallery
- Quick Measures Gallery
- 2021 MSBizAppsSummit Gallery
- 2020 MSBizAppsSummit Gallery
- 2019 MSBizAppsSummit Gallery
- Events
- Ideas
- Custom Visuals Ideas
- Issues
- Issues
- Events
- Upcoming Events
- Community Blog
- Power BI Community Blog
- Custom Visuals Community Blog
- Community Support
- Community Accounts & Registration
- Using the Community
- Community Feedback
Register now to learn Fabric in free live sessions led by the best Microsoft experts. From Apr 16 to May 9, in English and Spanish.
- Power BI forums
- Forums
- Get Help with Power BI
- Desktop
- Creating table visualisations showing inverse filt...
- Subscribe to RSS Feed
- Mark Topic as New
- Mark Topic as Read
- Float this Topic for Current User
- Bookmark
- Subscribe
- Printer Friendly Page
- Mark as New
- Bookmark
- Subscribe
- Mute
- Subscribe to RSS Feed
- Permalink
- Report Inappropriate Content
Creating table visualisations showing inverse filtering results
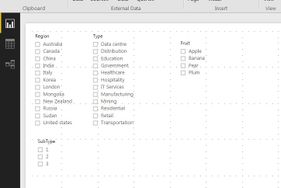
I'm wanting to have 3 different slicers and two visualisation tables, the first two slicers will normally filter two tables containing the same data then the third filter will result in one table showing the filtered selection and the other showing results not in the filtered selection (Without including the filtered selection.)
For example
- Firstly Filtering by the region so only showing results from the desired selection, then the sub type and type from that region.
e.g. "Australia,Data centres,2"
This will make both Table visualisations the same.
I then want to select the slicer 'fruit' and choosing Apple will show me in one table the list of "Australia,Data centres,2" with apples and the other will show the "Australia,Data centres,2" with Banana Pear and Plum (Or any data that isnt apples.)
Many Thanks
Solved! Go to Solution.
- Mark as New
- Bookmark
- Subscribe
- Mute
- Subscribe to RSS Feed
- Permalink
- Report Inappropriate Content
Hi @megskilton,
>>the third filter will result in one table showing the filtered selection and the other showing results not in the filtered selection (Without including the filtered selection.)
I can use measure to get the filtered records and the inverted result, but I haven't find a way to enable the measure as the source of slicer.
filter value:
VALUES(Table[ColumnName])
inverted filtered value:
EXCEPT(ALL(Table[ColumnName]), VALUES(Table[ColumnName]))
Measure use to display these value:
filtered =
var temp= CONCATENATEX(VALUES(Sheet2[Amount]),[Amount]&",")
return
if(LEN(temp)>0,LEFT(temp,LEN(temp)-1),temp)
inverted filtered =
var temp= CONCATENATEX(EXCEPT(ALL(Sheet2[Amount]), VALUES(Sheet2[Amount])),[Amount]&",")
return
if(LEN(temp)>0,LEFT(temp,LEN(temp)-1),temp)
Regards,
Xiaoxin Sheng
If this post helps, please consider accept as solution to help other members find it more quickly.
- Mark as New
- Bookmark
- Subscribe
- Mute
- Subscribe to RSS Feed
- Permalink
- Report Inappropriate Content
Hello,
I've been working with Power BI for a while now, but I do not do any custom measures, however I need to do something similar to what was posted here. What's the correct DAX statement for selecting the inverse?
I would like for my slicer to select all values that do not equal (the inverse) the value I select. All my values are text and I'd like for this to show up in a table visual. So for example, my slicer selects retailers within a shopping center that are categorized as "book stores" and I'd like to see which shopping centers DO NOT have a category of book stores.
What is the exact measures for this? Table 1 has only categories and Table 2 has categories and several other attributes associated with it. Would I only use 2 measures? If so, could/can you provide what those measures look like and which measures belongs to which table and once I've created the measures where do I drag and drop each (for slicer and table visual.)
All suggestions and help is greatly appreciated.
Thank you,
Andy
Helpful resources

Microsoft Fabric Learn Together
Covering the world! 9:00-10:30 AM Sydney, 4:00-5:30 PM CET (Paris/Berlin), 7:00-8:30 PM Mexico City

Power BI Monthly Update - April 2024
Check out the April 2024 Power BI update to learn about new features.

| User | Count |
|---|---|
| 112 | |
| 97 | |
| 85 | |
| 67 | |
| 59 |
| User | Count |
|---|---|
| 150 | |
| 120 | |
| 100 | |
| 87 | |
| 68 |

